- Ethereum price is trading in the red by some 0.50% the session on Friday.
- ETH/USD remains stuck within the stubborn bearish trend, running at five consecutive weeks in the red.
- A $140 breach by the bears, could be the trigger for a fresh bout of selling pressure.
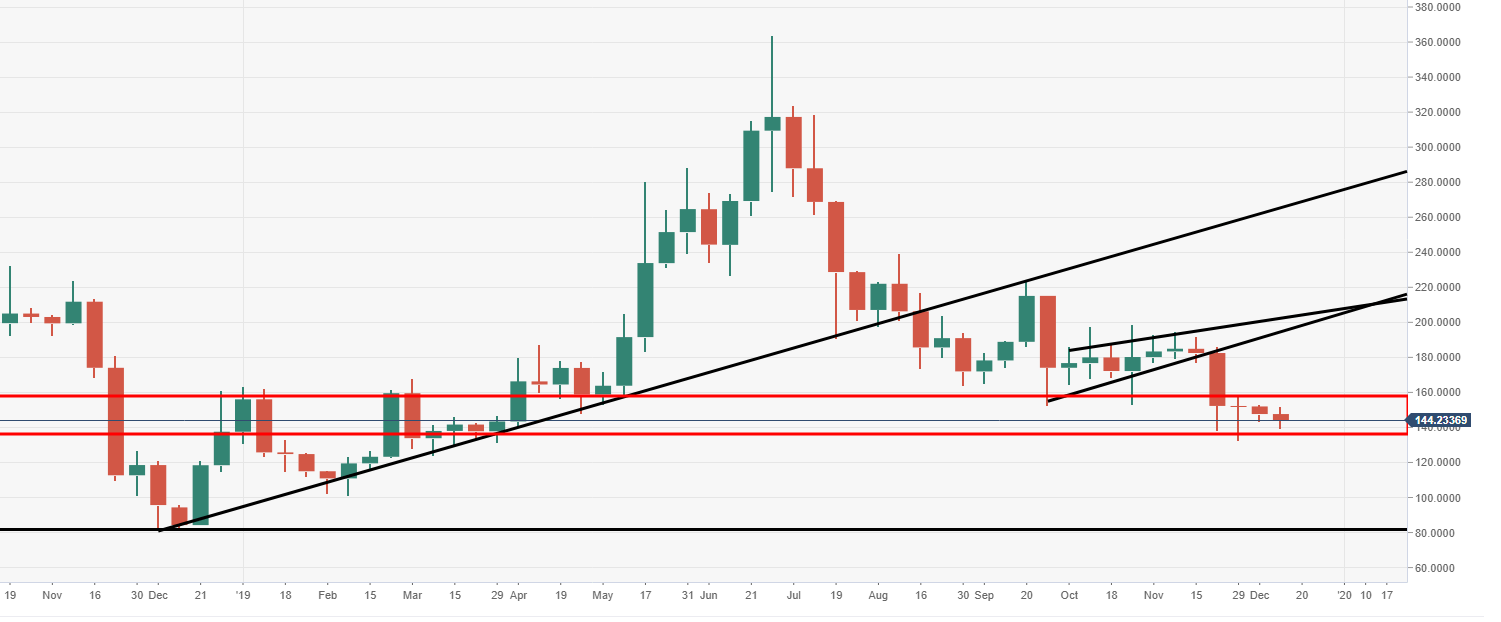
ETH/USD weekly chart
Should the bears force a breakout below the current demand area, $160-140, then the next major zone is seen down at $80.
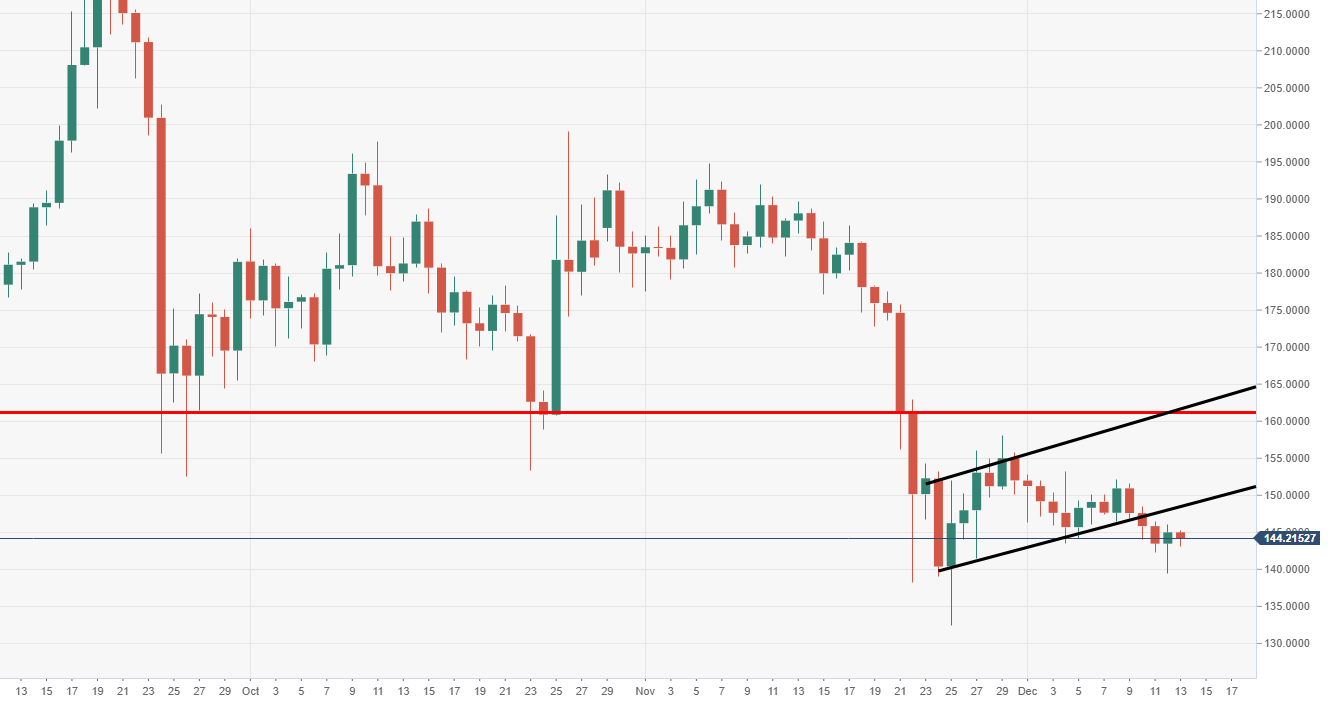
ETH/USD daily chart
Critical daily support at $160 was breached which has kept the bears on the front foot, with further downside pressure being eyed.
Spot rate: 144.22
Relative change: -0.30%
High: 145.28
Low: 143.10
