- Litecoin returns to the red in tandem with its crypto peers.
- Technical picture paints rangebound to bearish outlook in near-term.
The sixth most widely traded cryptocurrency, Litecoin (LTC/USD), with a market capitalization of $ 2.82 billion, is back in the red zone on Saturday after two straight days of tepid bounce. A fresh selling wave across the crypto markets dragged the prices lower. Despite the latest knockdown, the coin remains in a familiar trading range between $ 45 and $ 43. At the press time, the price trades near daily lows of 43.99, down 1% on the day while rising nearly 0.80% over the last 24 hours.
LTC/USD 1-hour chart
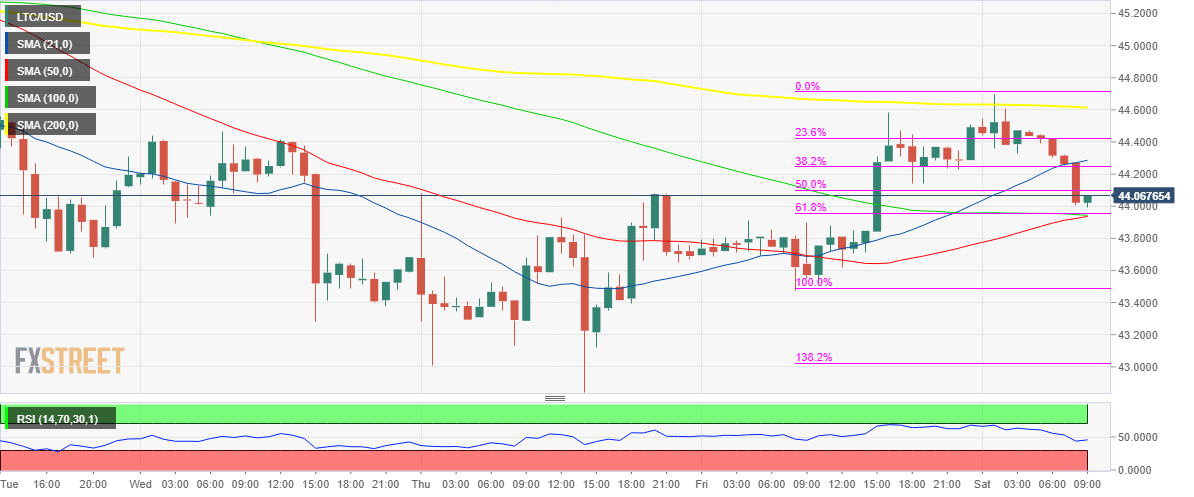
- Bears return on a failure to take-out stiff resistance just below the 45 handle.
- The coin tests key $ 43.90 support, the confluence of 61.8% Fib level of Friday’s rebound, horizontal 100-HMA and bullish 50-HMA.
- A breach of the last will trigger heavy selling towards nine-month lows of $ 42.35.
- A break above the horizontal 200HMA at $ 44.65 is needed for a bullish reversal.
LTC/USD daily chart
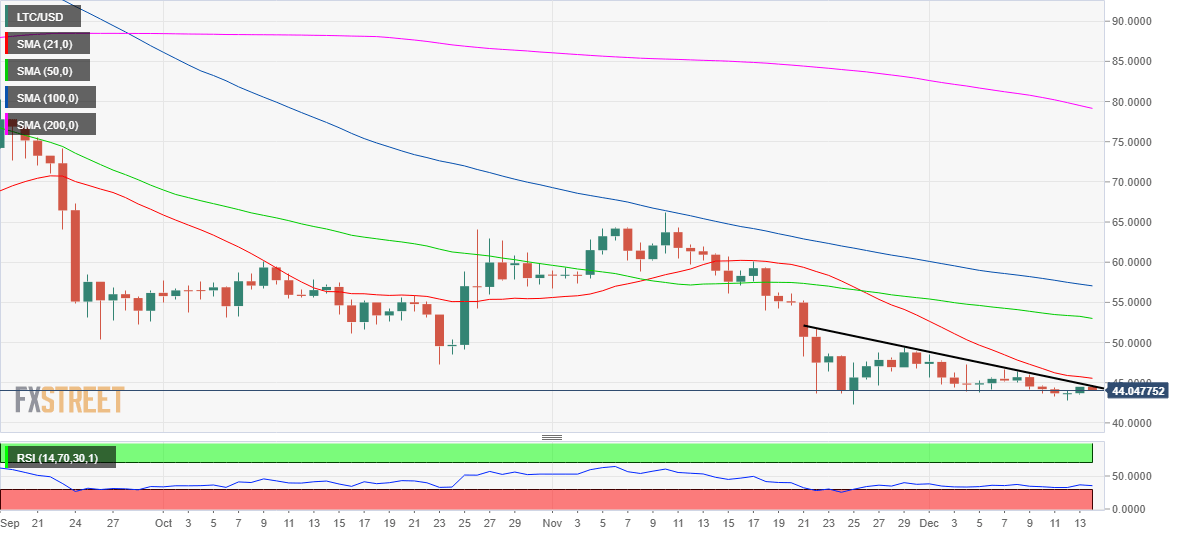
- Selling pressure remains intact, as prices remain below the descending trendline resistance at $ 44.50.
- Further, the bearish 21-DMA at $ 45.50 will continue to cap the recovery attempts.
- The path of least resistance remains to the downside amid a lack of significant demand area.
LTC/USD Levels to watch
