- The cryptocurrency market is gripped by bearish sentiments.
- BTC/USD struggles to recover above $7,000.
- Altcoins demonstrate deep declines following Bitcoin’s sell-off.
The bearish sentiments on the cryptocurrency market are growing stronger. While Bitcoin managed to stabilize after a sharp sell-off on Monday, altcoins continue losing ground with Ripple’s XRP down nearly 6% since the beginning of the day, DASH and Bitcoin Gold are down over 2%. The total capitalization of all digital assets in circulation dropped to $186 billion, while Bitcoin dominance increased to 67.2%.
BTC/USD: the technical picture
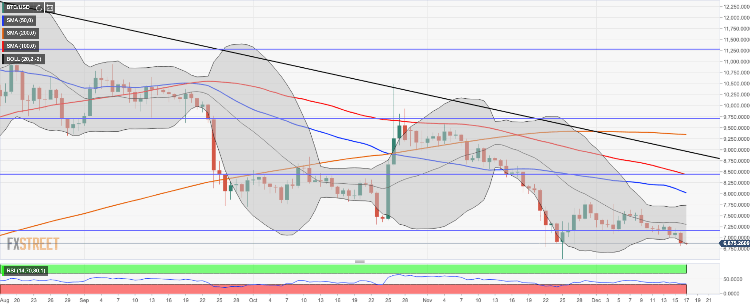
Bitcoin (BTC) broke free from the narrow channel and hit $6,818 low on Monday. This area served as excellent short-term support that stopped the decline; however, the recovery momentum is still nowhere to be seen. BTC/USD is trading at $6,873, mostly unchanged since the beginning of Tuesday and down 2.3% since the beginning of the day.
Obviously, aa sustainable move above $7,000 is a pre-condition for further recovery with the next focus on $7,300. This area served as a channel resistance, reinforced by the middle line of the daily Bollinger Band, the upper border of 4-hour Bollinger Band and SMA100 (Simple Moving Average) 4-hour.
On the downside, the essential support is created by $6,500. This area encompasses the lowest level of the previous month. If it is cleared, the sell-off may continue towards the next barrier of $6,350 ( the lower line of the weekly Bollinger Band) and psychological $6,000.
BTC/USD, the daily chart
ETH/USD: the technical picture
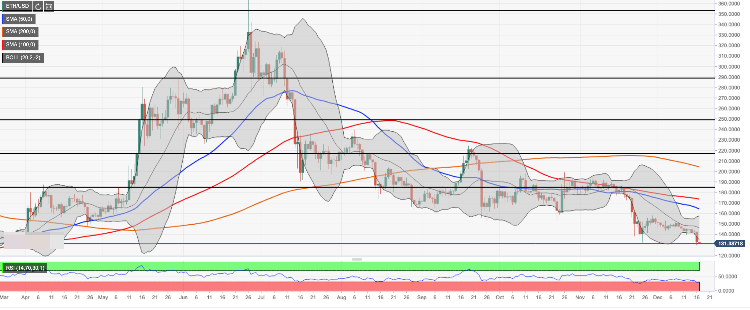
While ETH/USD has recovered from Monday’s low of $129.71 to trade at $131.27 at the time of writing. The coin is moving within the long-term downside trend with little signs of the upcoming reversal. As ETH/USD is moving in sync with the market, we might not see the recovery until the broader market resumes the growth.
ETH/USD has lost 6.6% on a day-to-day basis and 1$ since the beginning of Tuesday.
From the technical point of view, we will need to see a sustainable move above psychological $140.00 to mitigate the immediate pressure and allow for an extended recovery towards $146.00. This barrier is created by the middle line of the daily Bollinger Band and SMA100 (Simple Moving Average) 4-hour. Ultimate resistance still awaits us on approach to psychological $150.00; however, considering the downside-looking RSI (Relative Strength Index), the upside may be limited.
On the downside, Once the recent low of $129.70 is out of the way, the bearish momentum will gain traction with the next focus on $125.00 (Pivot Point 1-mont support 1) and $120.00.
ETH/USD, the daily chart
XRP/USD: the technical picture
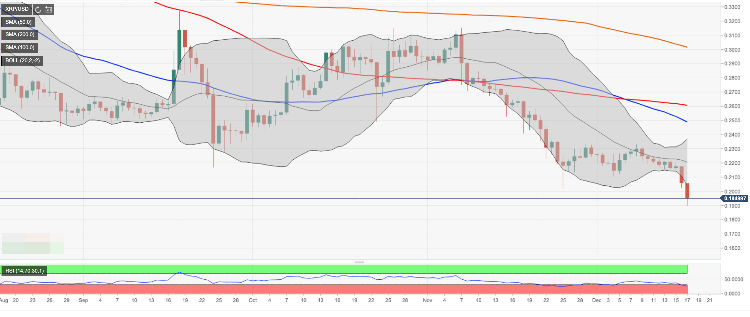
XRP/USD is one of the biggest losers out of top-20 today. The coin has lost over 8% of its value in recent 24 hours and broke below $0.1900 handle during early Asian hours. This development has worsened the short-term technical picture and brought $0.1800 back in focus, which is the lowest level since November 2017. At the time of writing, XRP/USD is changing hands at $0.1950
Despite the recovery after crypto winter, XRP/USD has lost over 44% since January and basically returned to the levels that preceded the big crypto rally.
From the technical point of view, the coin has entered uncharted territory. We may be staring down at the abyss unless the co-called XRP Army braces up and push the price back above $0.2000. This development will mitigate the initial bearish pressure and allow for an extended recovery with the next focus on $0.22. This area served as a resistance level since December 10. Now it is reinforced by the middle line of the daily Bollinger Band and SMA100 (Simple Moving Average) 1-hour located on approach.
XRP/USD, the daily chart
Get 24/7 Crypto updates in our social media channels: Give us a follow at @FXSCrypto and our FXStreet Crypto Trading Telegram channel.
