- BTC/USD bulls will need to rally together to defend the historically critical $6,500 support level.
- ETH/USD hourly chart shows that the bulls are struggling to get past the $132.75 resistance level.
BTC/USD daily chart
-637122459958160212.png)
After dropping from $6,877.65 to $6,612.15 this Tuesday, the bulls have rallied back to take price back up to $6,660. The bulls will have to break past the resistance provided by the downward trending line and the resistance at $6,907.50. The Relative Strength Index is hovering at the edge of the oversold zone.
BTC/USD four-hour chart
-637122460940053569.png)
The four-hour chart was trending below the 20-day Bollinger Band, indicating that the asset is underpriced. The price charted a Morning Star pattern to re-enter the band. The 20-day Bollinger Jaw has widened, indicating increasing market volatility, while the Elliott Oscillator has had 14 straight red sessions of increasing intensity.
BTC/USD hourly chart
-637122461340060450.png)
The hourly BTC/USD chart found support at the $6,582.25 line and bounced up. However, the bulls couldn’t get past the resistance at $6,695-line and the SMA 20 curve. The Moving Average Convergence/Divergence shows that the short-term market sentiment is bullish.
Key Levels
ETH/USD daily chart
-637122462009760266.png)
ETH/USD is trending in a downward channel formation and has dropped from $143 to $122.20 over Monday and Tuesday. Currently, the bulls were able to take the price up to $123.20. The Relative Strength Index (RSI) indicator has dipped into 21.87 before going up to 23.40.
ETH/USD four-hour chart
-637122462525863680.png)
ETH/USD four-hour chart was moving horizontally in a narrow range before it dropped from $141 to $132. Following that, it moved horizontally again, before the bears dropped the price down further to $122.15 in a 12-hour period. The Elliott Oscillator shows 14 straight red sessions.
ETH/USD hourly chart
-637122463054309732.png)
The hourly ETH/USD found support at the $121.15, moved up, entered the 20-day Bollinger Band and encountered stiff resistance at the $125-level. The price is hovering below the SMA 200, SMA 50 and SMA 20 curves. The Moving Average Convergence/Divergence (MACD) shows increasing bullish momentum in the short-term.
Key Levels
XRP/USD daily chart
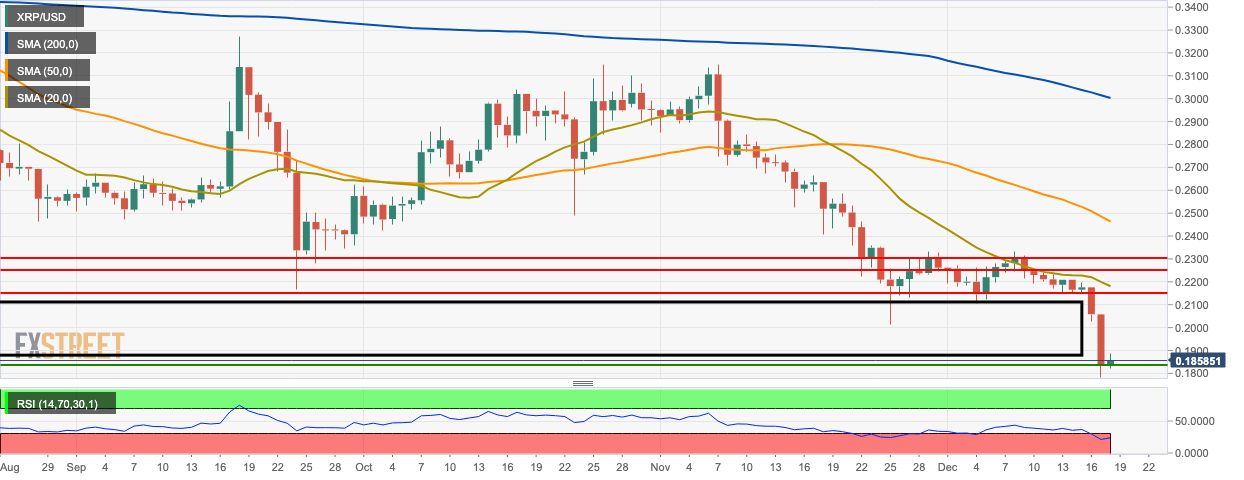
Over Monday and Tuesday, XRP/USD dropped from $0.218 to $0.184. XRP/USD has not been priced this low since May 2017. Currently, this is a critical moment for the XRP/USD buyers since they will need to fight back and prevent any further drops. The RSI indicator is trending within the oversold zone.
XRP/USD four-hour chart
-637122464167443884.png)
XRP/USD dropped from $0.198 to $0.182 in an eight-hour period and went below the 20-day Bollinger Band, indicating that it was underpriced. The buyers eventually found support at the $0.182-line and re-entered the Bollinger Band. The Bollinger jaw has widened immensely, indicating increasing market volatility.
XRP/USD hourly chart
-637122464616355127.png)
The hourly XRP/USD chart has found support at the $0.18-line and bounced up in an upwards channel formation. The bulls struggled to break past resistance at the $0.187 line before it went down. Currently, XRP/USD is looking to break below the channel.
Key Levels
