- ETH/USD fell from $133.20 to $128.40 this Thursday.
- The hourly chart is trending along horizontally.
ETH/USD daily chart
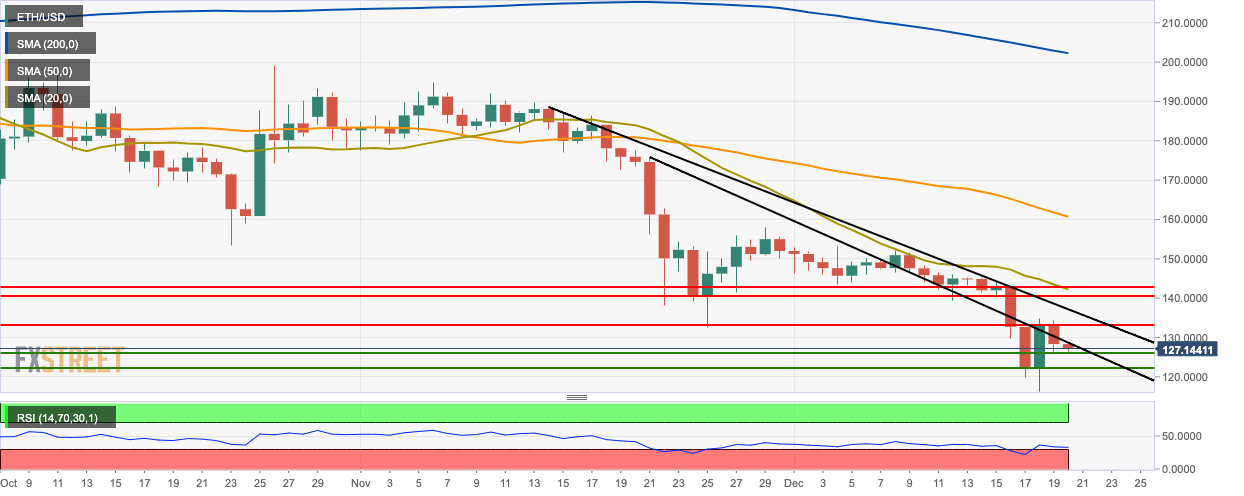
The daily chart has encountered resistance at the downward trending line. This Thursday, the price of the asset fell from $133.20 to $128.40 and has since dropped further to $127.10. The price is hovering below the 200-day Simple Moving Average (SMA 200), SMA 50 and SMA 20 curves. The Relative Strength Index (RSI) indicator is trending around 32.75 next to the oversold zone.
ETH/USD four-hour chart
-637124030227510134.png)
ETH/USD four-hour chart was consolidating in a triangular formation before it fell below the pattern. The latest price session has broken below the support provided by the SMA 20 curve. The Elliott Oscillator has had nine green sessions out of the last ten.
ETH/USD hourly chart
-637124030911632941.png)
The hourly ETH/USD is creeping along horizontally. The price is sandwiched between SMA 50 on the downside and SMA 20 on the upside. The 20-day Bollinger jaw has narrowed considerably, indicating decreasing price volatility. The Moving Average Convergence/Divergence (MACD) indicates sluggish bearish momentum.
Key Levels
