- Buying power indicators in the XRP are at unprecedented levels of pessimism.
- Bitcoin is positioned to lead the upward movement should it happen.
- Ethereum loses strength and reveals its weaker side.
Today it is worth highlighting the extreme technical situation in the XRP, as I explain in the technical section. Rarely does the market offer these opportunities.
In my last Top 3 coverage of the year, I am not going to give you a forecast as we will be publishing an extensive article about it next week. However, there are outside predictions that fill the headlines.
Tim Draper, an American venture capital investor, updates a prediction made two months ago as to when Bitcoin will reach $250,000. Draper, with a significant stake in Tezos (XTZ), now states that this goal could be reached six to twelve months after the next halving event in May 2020.
According to Draper, the price explosion will come from an exponential increase in the adoption of Bitcoin by the general public.
In my opinion, this prediction is very optimistic from a technical point of view. If it happens, it could be counterproductive because of the implications in volatility and, as a derivative, in credibility. In any case, I will make my arguments in the Bitcoin Forecast 2020.
ETH/BTC Daily Chart
ETH/BTC is currently trading at the price level of 0.01784 and is losing support due to price congestion at 0.018.
Some Twitter profiles claim that there are wallets loaded with stolen Ethereums and that criminals may try to exchange them for Bitcoins anonymously.
Above the current price, the first resistance level is at 0.018, then the second at 0.019 and the third one at 0.020. The strength of the third resistance is significant, as it is at this level that the SMA100, the EMA50, a price congestion resistance and finally the long term downward trend line converge.
Below the current price, the first support level is at 0.0173, then the second at 0.0162 and the third one at 0.014. A close below the recent lows would be critical for the ETH/USD.
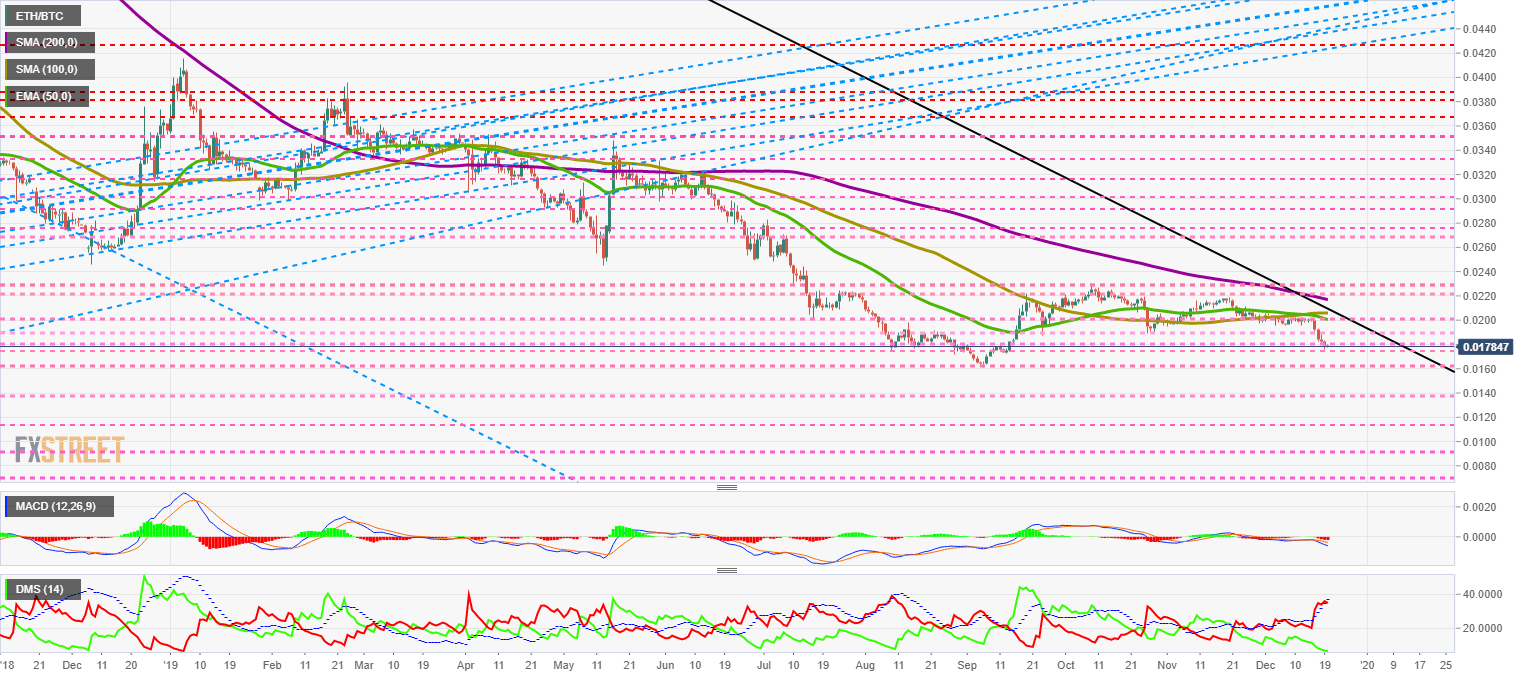
The MACD on the daily chart is sloping lower. The current profile of this indicator would allow for a slight upward shift as money enters the Ethereum side.
The DMI on the daily chart shows an extreme situation on both sides of the market. The bulls are falling below the December 2018 levels, just before the last upward movement in the ETH/BTC pair.
BTC/USD Daily Chart
The BTC/USD is currently trading at $7,134 and remains at yesterday’s $7,000 level. The Bitcoin has improved its technical structure, with a large bullish candlestick that brings the price back to an area where the market feels much calmer. Moving averages are between $7,750 and $9,350.
Above the current price, the first resistance level is at $7,400, then the second at $7,600 and the third one at $7,750.
Below the current price, the first support level is at $7,100, then the second at $6,850 and the third one at $6,750.
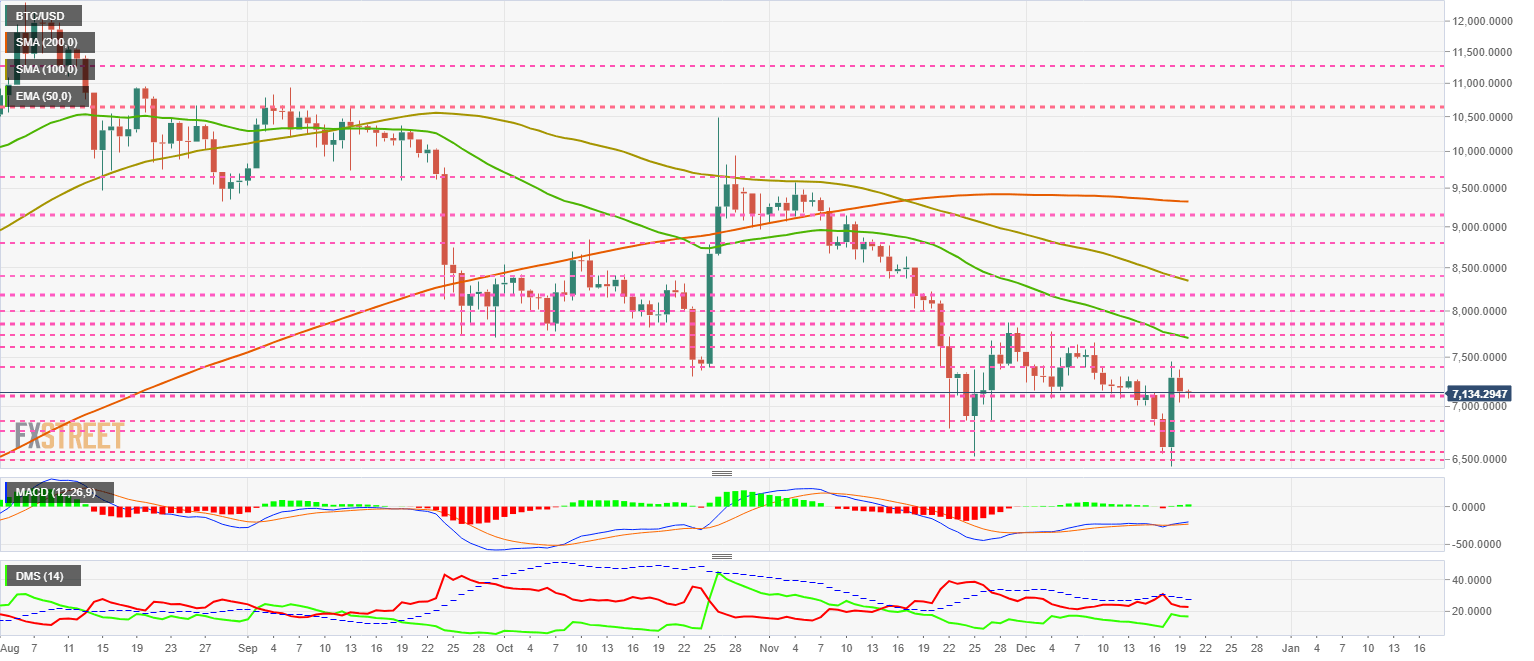
The MACD on the daily chart is rising and diverging from the price. Yesterday’s significant rise is not reflected in the distance between the lines and will require more money to take an optimal profile.
The DMI on the daily chart shows the two sides of the market moving nearby and are now in a position to see a change in leadership.
ETH/USD Daily Chart
The ETH/USD is currently trading at $127.46, dropping to $130 and remaining in the area of the latest downward movement.
Above the current price, the first resistance level is at $130, then the second at $140 and the third one at $150.
Below the current price, the first support level is at $125, then the second at $120 and the third one at $115.
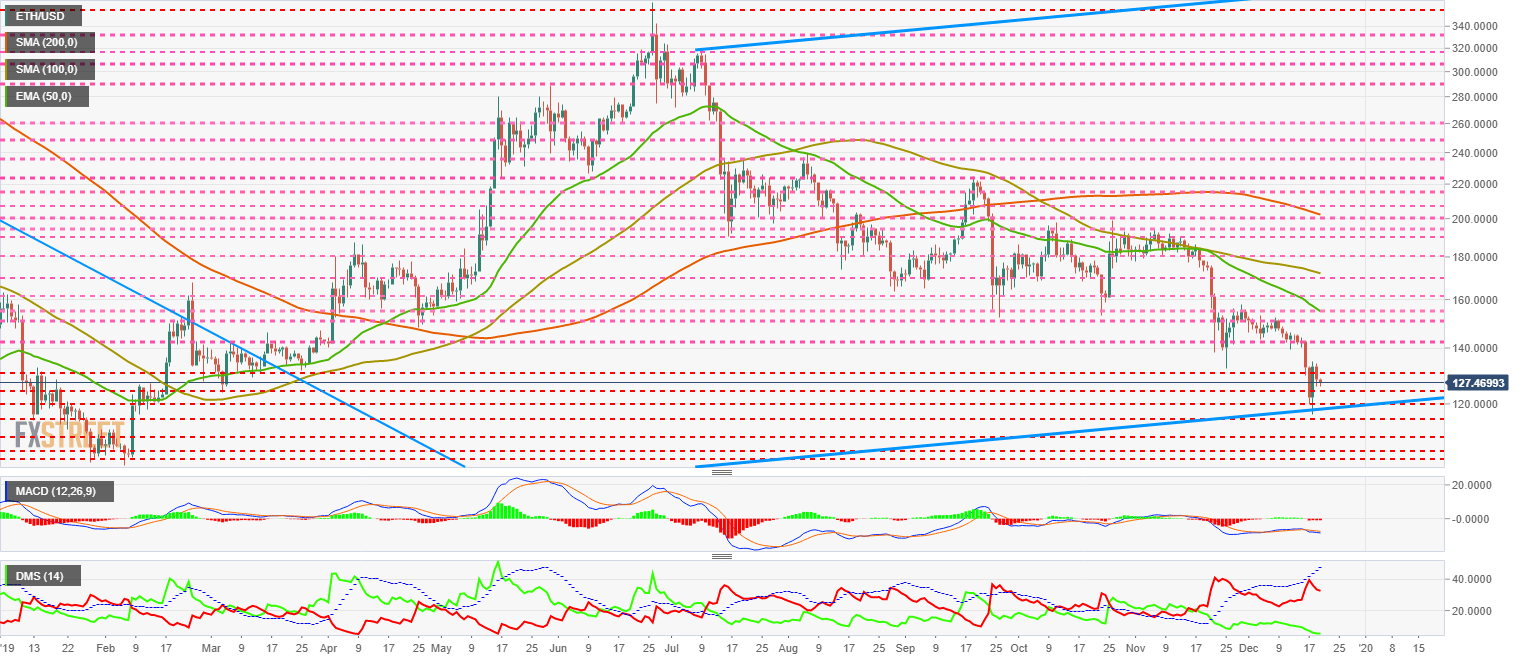
The MACD on the daily chart confirms the bearish momentum and, unlike the BTC/USD, shows no intention of crossing over to the upside. It does show a divergent structure but without the confirmation that a bullish cross is coming.
The DMI on the daily chart shows that the current weakness is coming from a missing buy-side and is going to a low level not seen since August 2018. Bears are moving in the usual range of the ETH/USD bearish move.
XRP/USD Daily Chart
The XRP/USD is currently trading at the price level of $0.1865, supported by the long term downward channel upper line that has been in place since December 2017.
Above the current price, the first resistance level is at $0.20, then the second at $0.22 and the third one at $0.24.
Below the current price, only one support level should concern us, and that is the roof of the bearish channel. Below those level things would get very complicated, panic would take over the market, and we could see the price of the XRP/USD pair below $0.10.
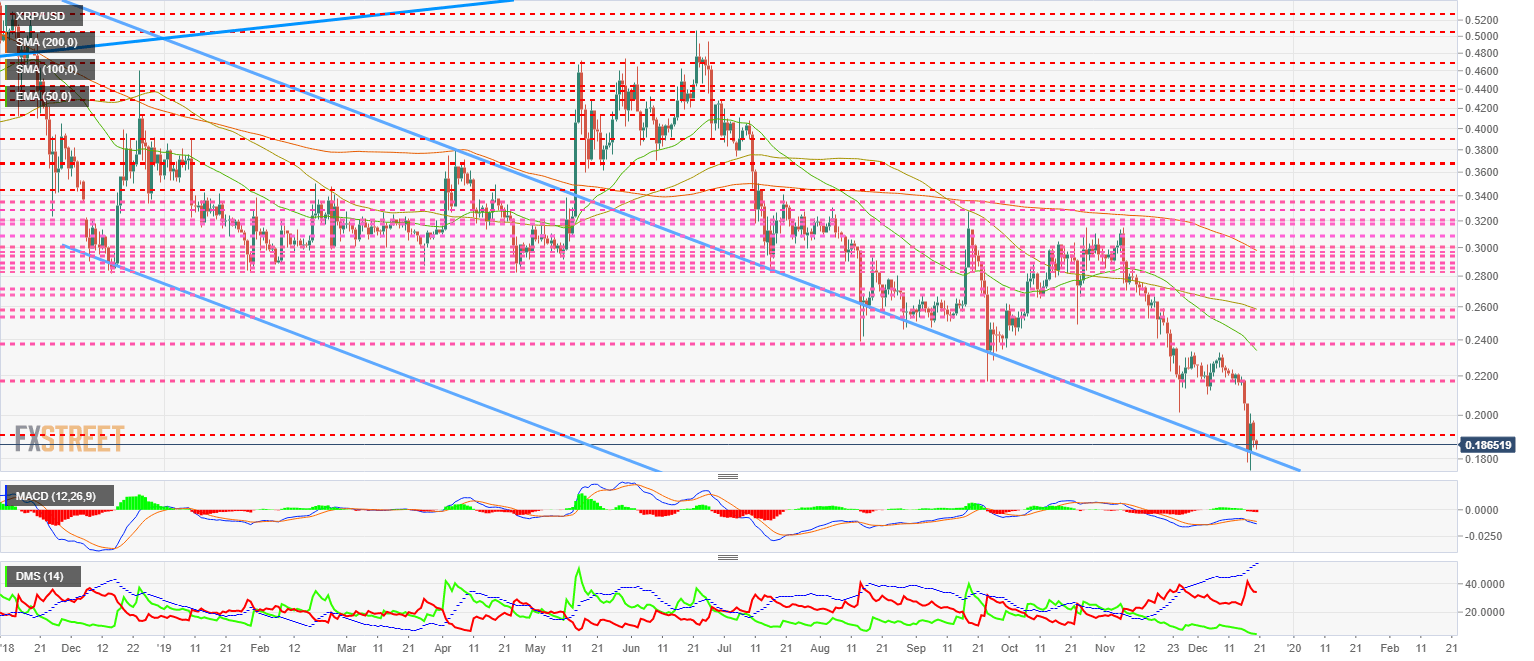
The MACD on the daily chart shows a divergent profile with the price, and statistically, it tends to rise. The situation is optimal for bullish traders, with clear stops below $0.1752.
The DMI on the daily chart comes in at record levels on the bullish side, going to the lowest level since mid-2017. This situation is exceptionally bullish due to a simple return to the mean, although safety standards must be maintained and stop levels adjusted. The bears, on the other hand, do not set record levels and continue to develop a bearish pattern.
Get 24/7 Crypto updates in our social media channels: Give us a follow at @FXSCrypto and our FXStreet Crypto Trading Telegram channel
