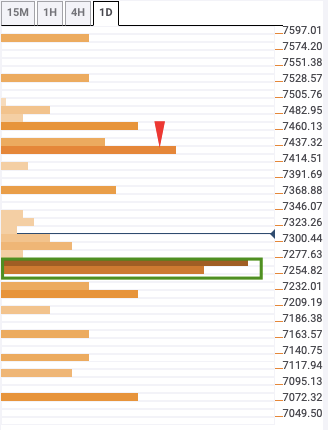
BTC/USD: Strong stack of support between $7,255 and $7,275 is holding the price up
BTC/USD is on course of charting two bearish days in a row. This Monday, the price of the asset fell from $7,512.75 to $7,315 and has fallen further to $7,292.15.
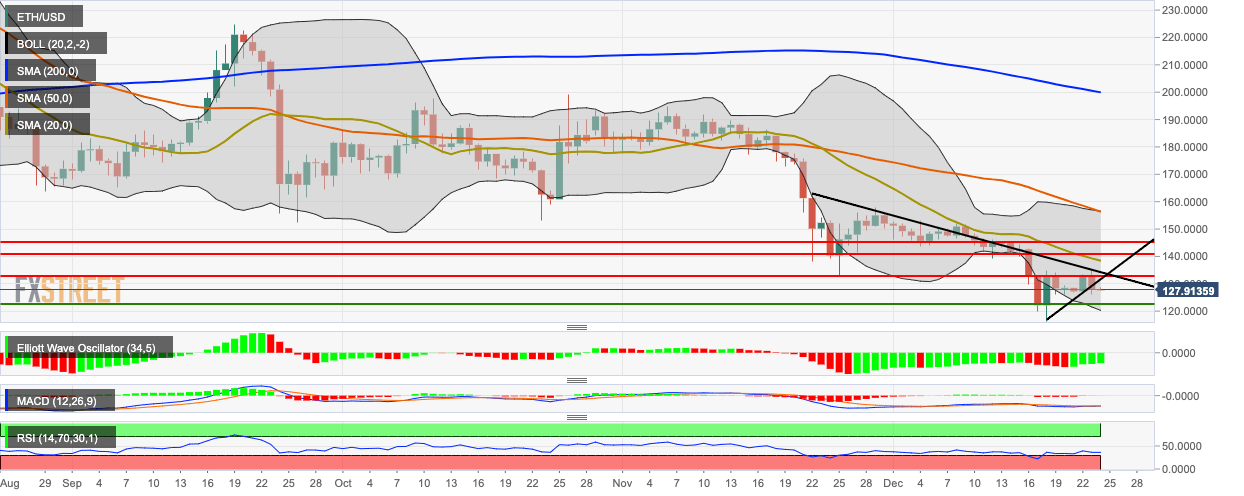
ETH/USD price falls below the triangle pattern
ETH/USD is on course of charting two consecutive bearish days. The price fell from $132.50 to $128 this Monday and has fallen further to $127.80. In the process, Ethereum dropped below the triangle formation. The bulls must overcome resistance at the downward trending line and the 20-day Simple Moving Average (SMA 20) curve.
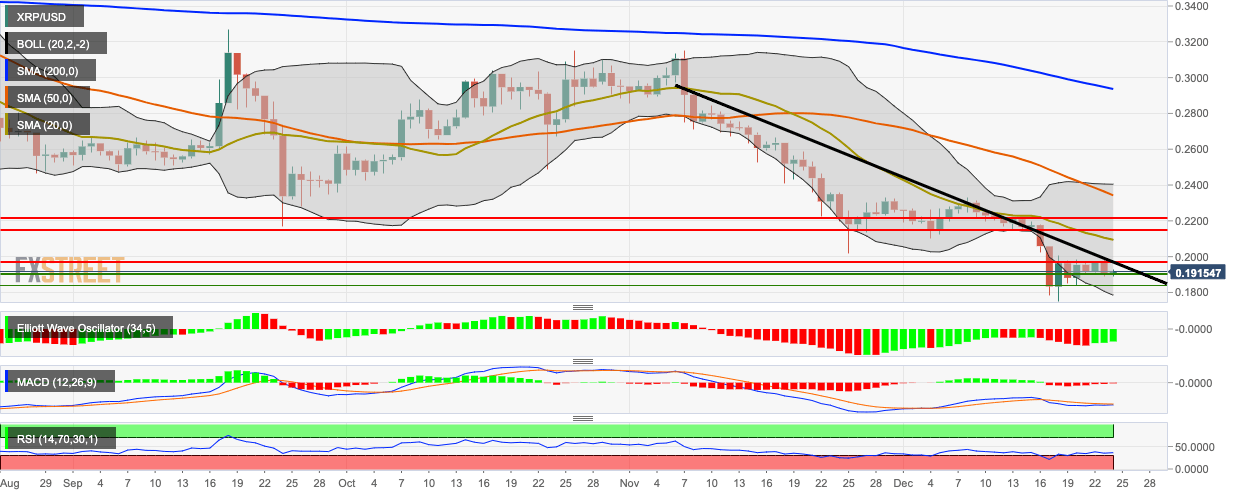
XRP/USD bulls take control of the market following a bearish Monday
XRP/USD bulls have re-entered the market as the price went up slightly from $0.19 to $0.191 this Tuesday. This follows a bearish Monday, wherein the price dropped from $0.197 to $0.19. The price is hovering below the 200-day Simple Moving Average (SMA 200), SMA 50 and SMA 20 curves and trending in the lower half of the 20-day Bollinger Band.