- Ethereum price is trading in the red by 2.30% in the session on Tuesday.
- ETH/USD bull momentum hits a roadblock, running into a supply zone ahead of $150.
- A retest of the psychological $140 price barrier is at present in play.
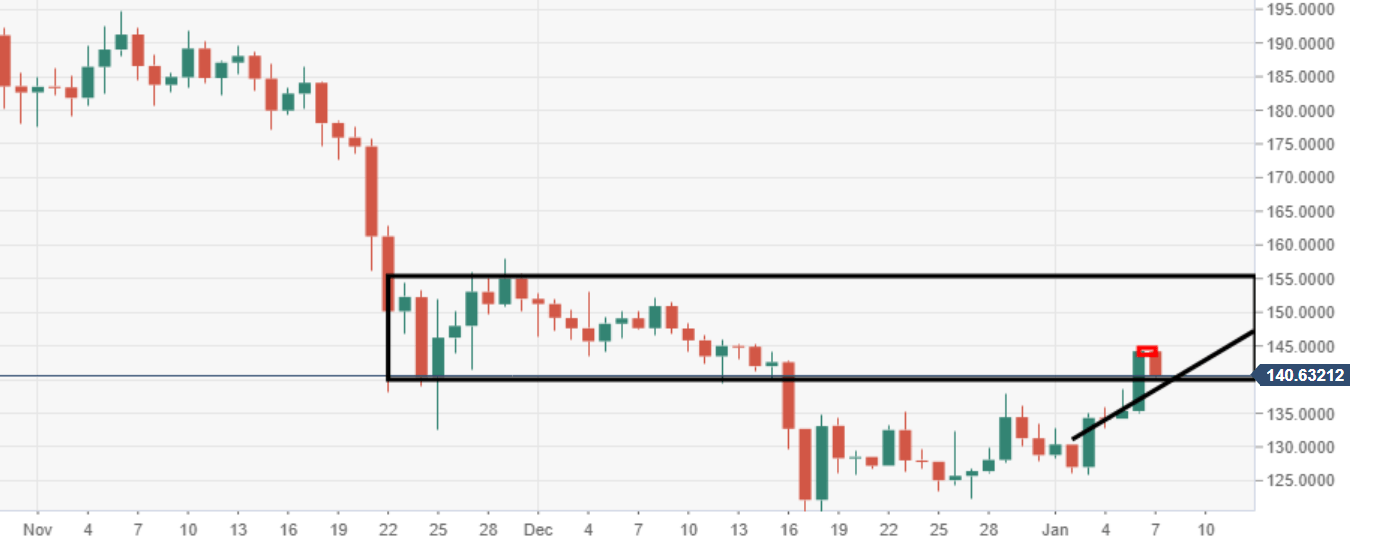
ETH/USD daily chart
A chunky area of supply should be noted at a former range area for ETH/USD, which formed between 23 November – 15 December before breakout out. It is now acting as resistance, $140-155 range.
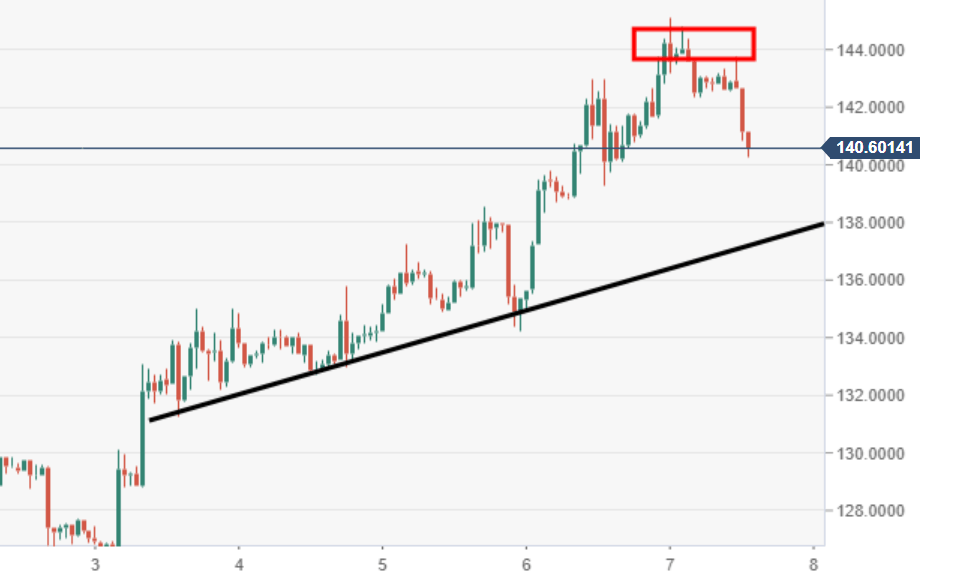
ETH/USD 60-minute chart
Price action heading towards a retest of a critical near-term ascending trend line of support.
Spot rate: 141.19
Relative change: -2.50%
High: 145.13
Low: 140.25
