- Ethereum price is trading in the red by +0.60% in the session on Friday.
- Price action is running at its fourth consecutive session in the red, as the bears maintain full control.
- Vulnerabilities remain tilted to the downside, with rallies at risk of continuing to be sold.
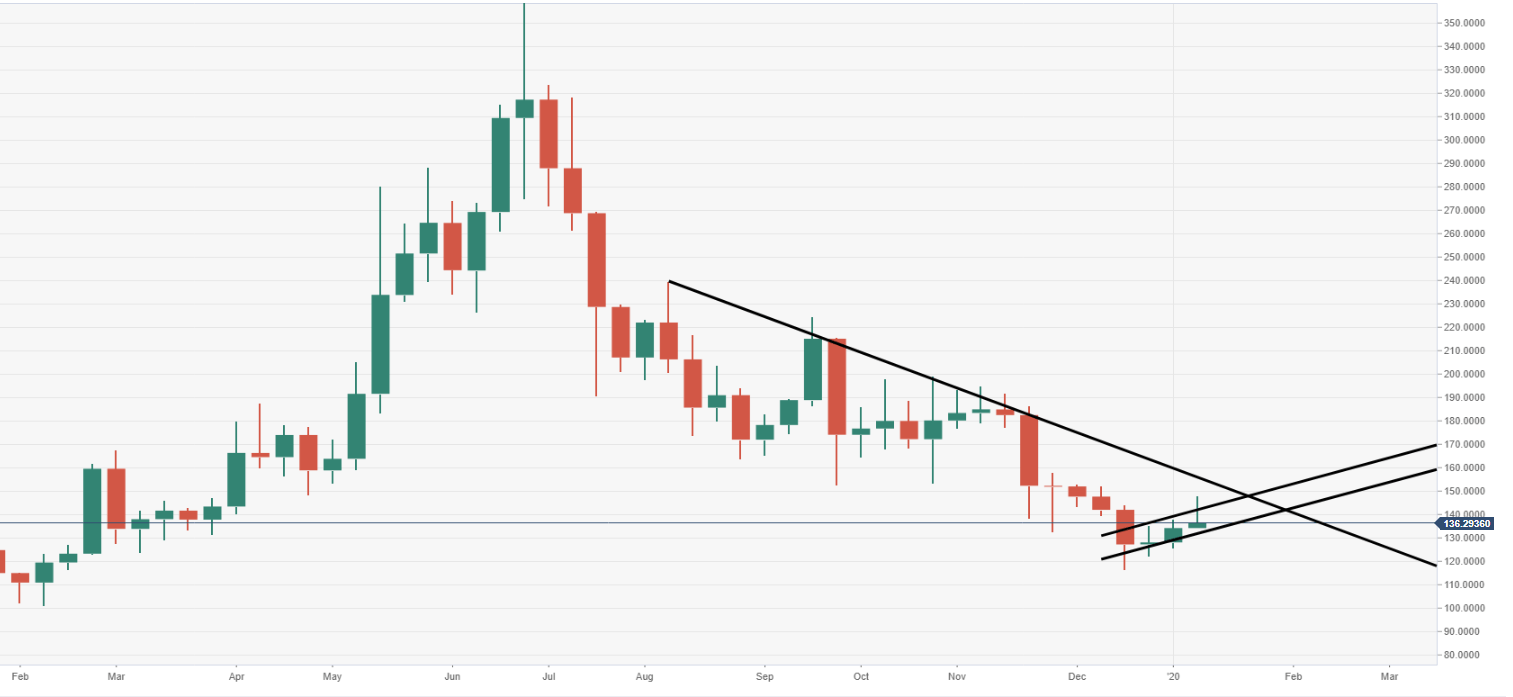
ETH/USD weekly chart
The price is running towards its third potential consecutive week in the green, it comes after six straight weeks in the red. Weekly resistance should be noted at $150, descending trend line.
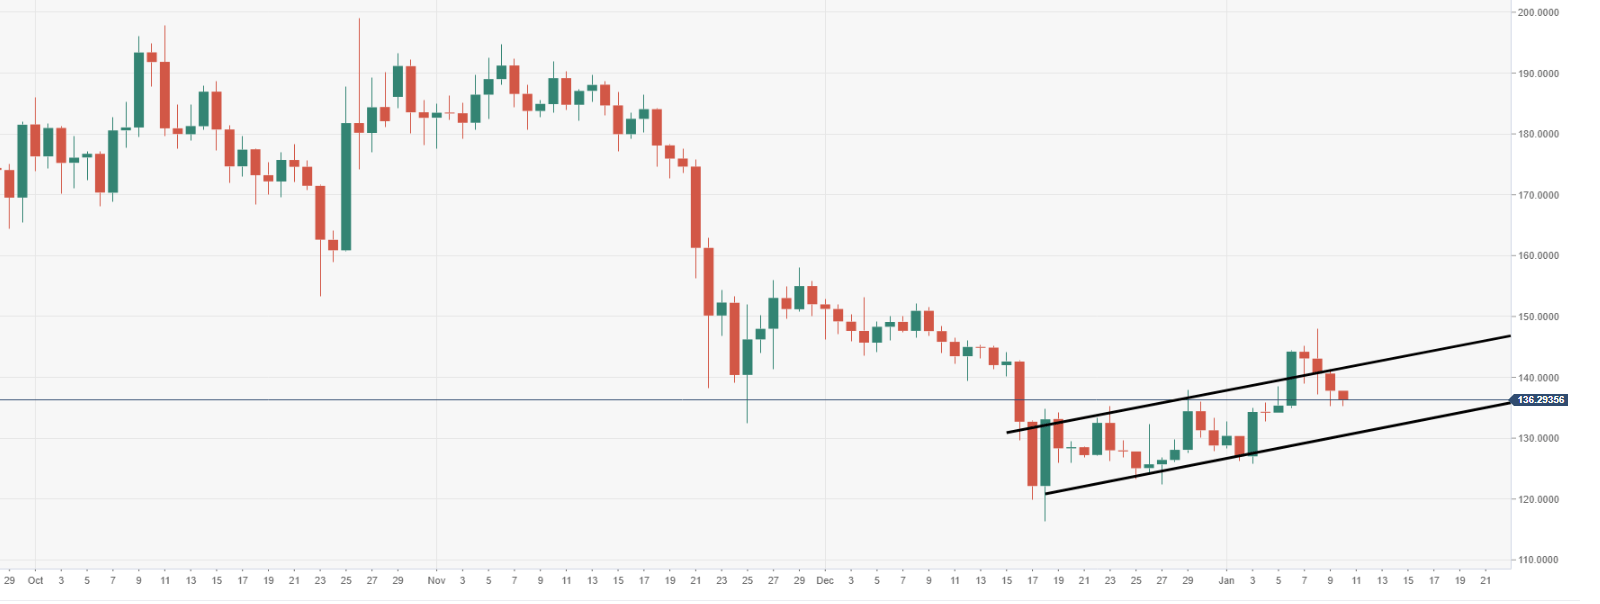
ETH/USD daily chart
Price action has been forced to trade back within a bearish flag structure via the daily chart view.
Spot rate: 138.74
Relative change: +0.60%
High: 139.80
Low: 135.18
