- Ethereum price is trading in the red by 2.40% in the session on Monday.
- Price action is regathering some upside, following three sessions in the red.
- Vulnerabilities still remain tilted to the downside, with rallies at risk of continuing to be sold.
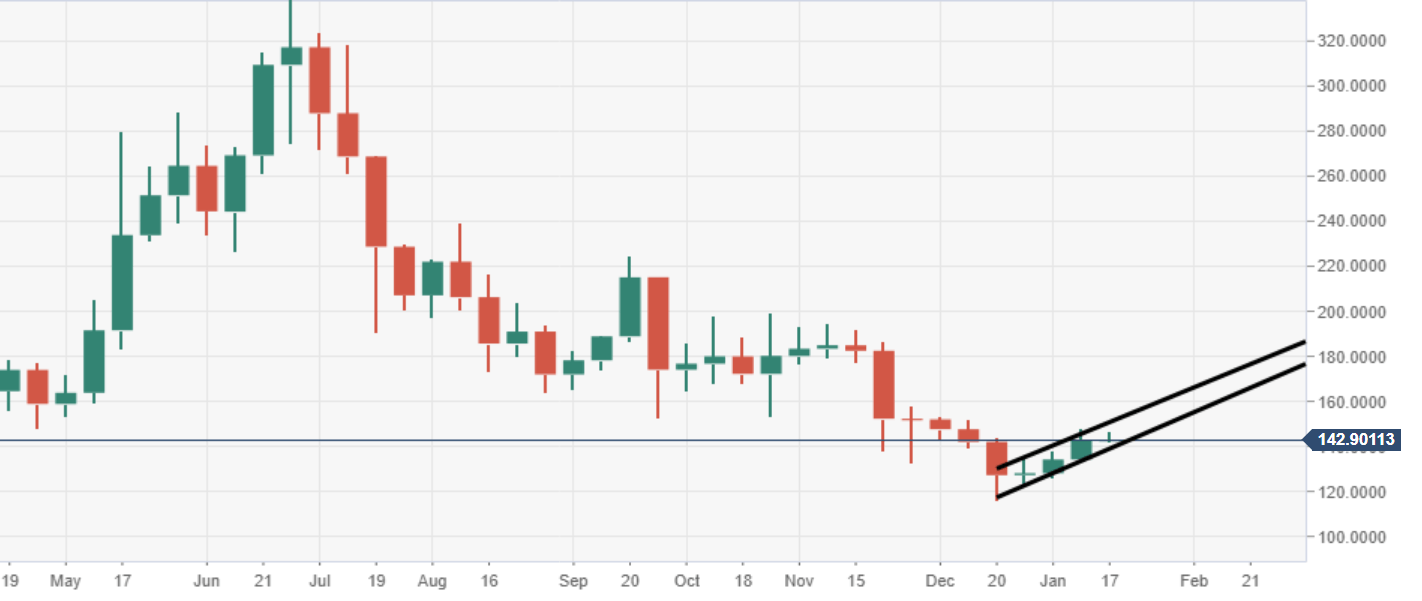
ETH/USD weekly chart
Momentum is gradually shifting towards the upside, as ETH/USD is now closed another week in the green, as it marks the third in a row. It comes after six consecutive weeks of selling for the Ethereum price.
ETH/USD daily chart
The price is continuing to trade within a bearish flag, subject to a potential breakout south.
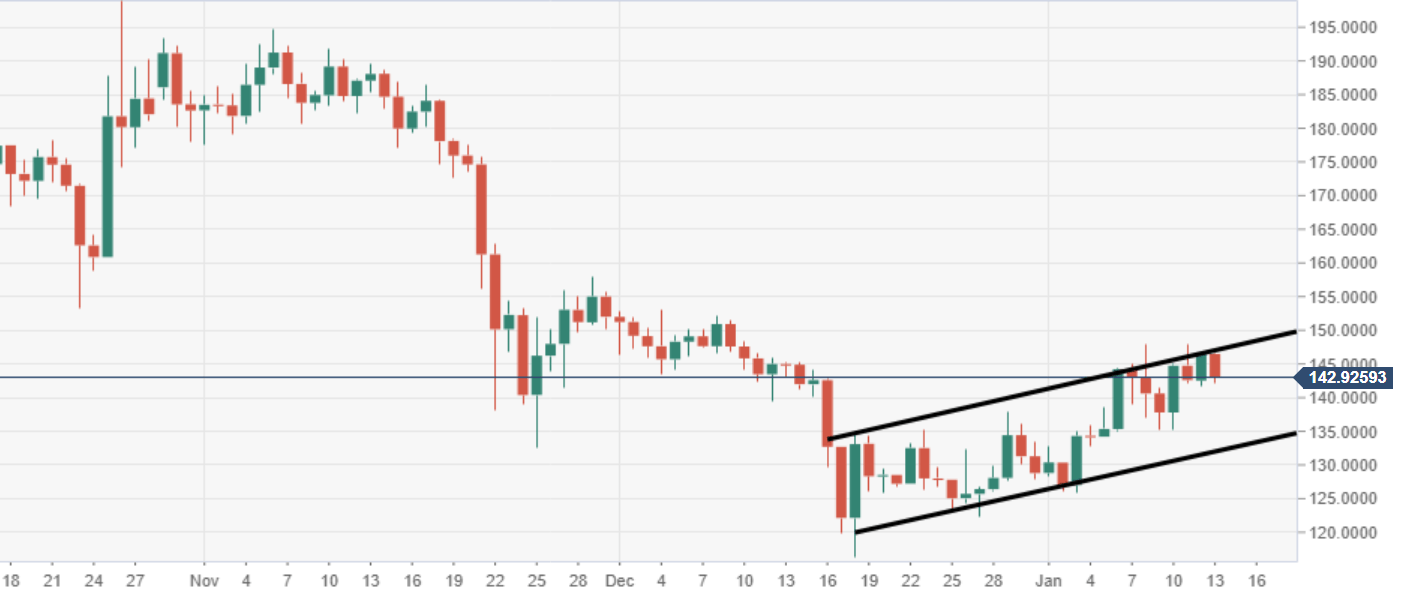
Spot rate: 142.96
Relative change: -2.40%
High: 146.95
Low: 142.15
