- LTC/USD has found obstruction at the green Ichimoku cloud.
- The Eliott Oscillator shows 11 straight green sessions of increasing intensity.
LTC/USD daily chart
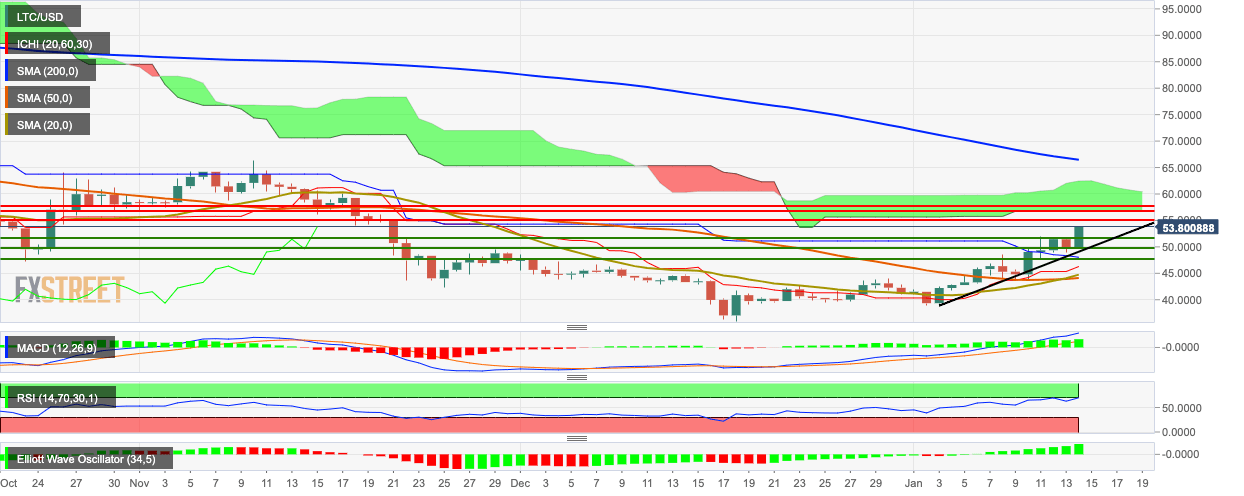
LTC/USD jumped from $49.60 to $53.60 this Tuesday, following a bearish Monday where it fell from $51.45 to $49.60. The price needs to overcome resistance at the green Ichimoku cloud and is bouncing off the support at the upward trending line. The 20-day Simple Moving Average (SMA 20) has crossed over with the SMA 50, which is a bullish sign. The Relative Strength Index (RSI) indicator has crept into the overbought zone, hinting at upcoming bearish correction. The Moving Average Convergence/Divergence (MACD) indicates sustained bullish momentum, while the Elliott Oscillator shows ten straight green sessions of increasing intensity.
