- The bulls are aiming for the $3.50 psychological level.
- The Elliott Oscillator shows sustained bullish sentiment.
EOS/USD daily chart
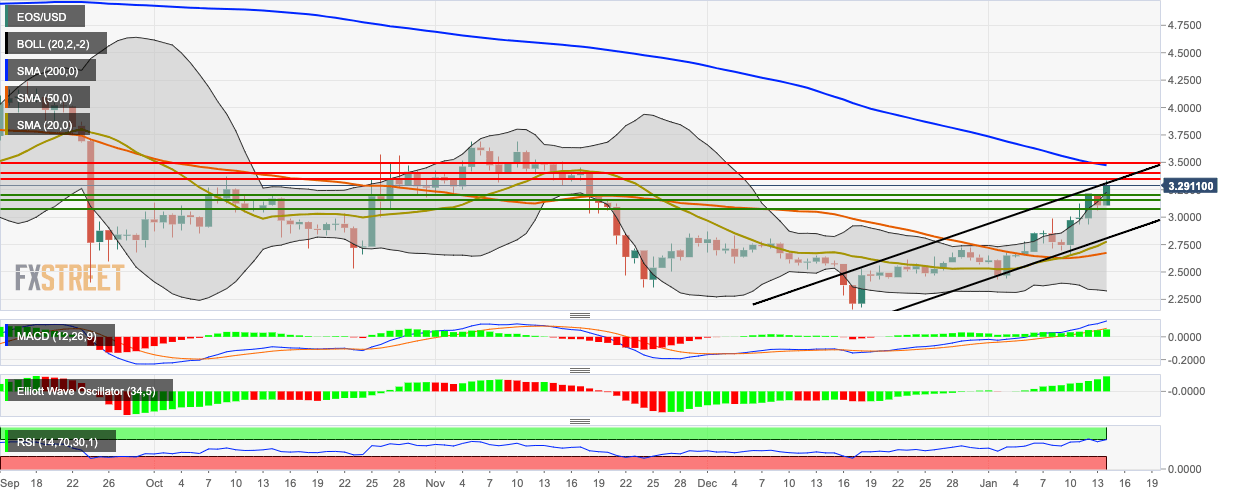
Following a bearish Monday, EOS/USD bulls jumped back into the driver’s seat and took the price up from $3.10 to $3.29. EOS/USD is trending in an upwards channel formation and has crept above the 20-day Bollinger Band, indicating that the asset is overpriced. This, along with the fact that the Relative Strength Index (RSI) has crept into the overbought zone, both hint that bearish correction may be round the corner. Both the Moving Average Convergence/Divergence (MACD) and Elliott Oscillator indicate sustained bullish sentiment.
