- BCH/USD is hovering above the green Ichimoku cloud.
- The RSI index is about to drop below the overbought zone.
BCH/USD daily chart
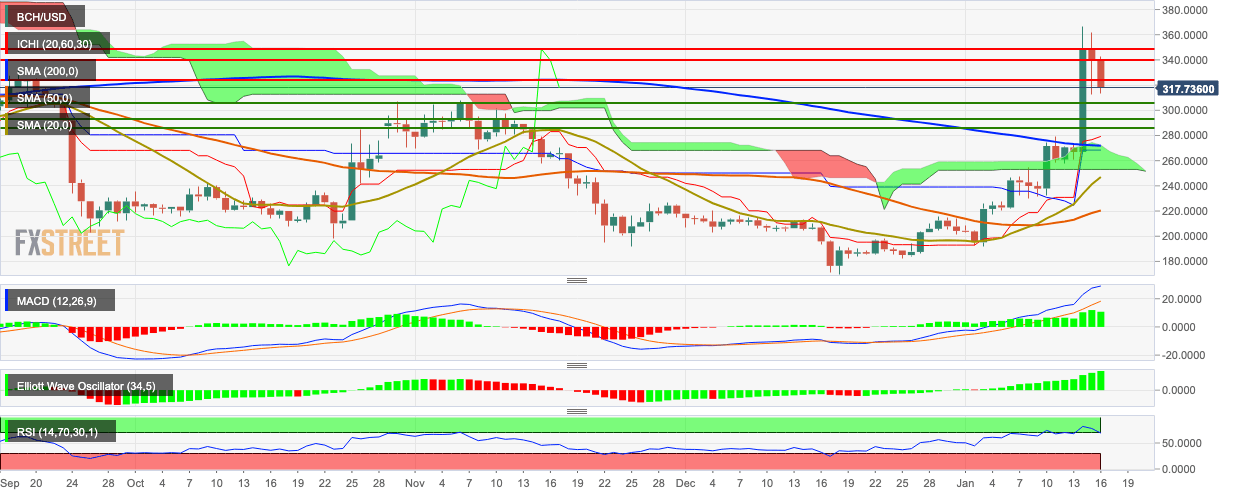
BCH/USD is on course of charting its second straight bearish day, as the price fell from $339.75 to $314.60 in the early hours of Thursday. Before this, BCH/USD bulls ran out of steam near the $350-level and fell from $348.60 to $339.75. The price is still hovering above the green Ichimoku cloud, 200-day Simple Moving Average (SMA 200), SMA 50 and SMA 20 curves. The Moving Average Convergence/Divergence (MACD) and Elliott Oscillator both indicate sustained bullish sentiment. The Relative Strength Index (RSI) indicator is looking to fall below the overbought zone, following bearish correction.
