Home Ethereum Price Analysis: ETH/USD vulnerabilities given bearish daily candle
Crypto News

Ethereum Price Analysis: ETH/USD vulnerabilities given bearish daily candle

  • Ethereum price is trading in the red by -0.80% in the session on Thursday. 
  • The daily candle on Wednesday produces a doji candlestick to indicate a potential reversal. 
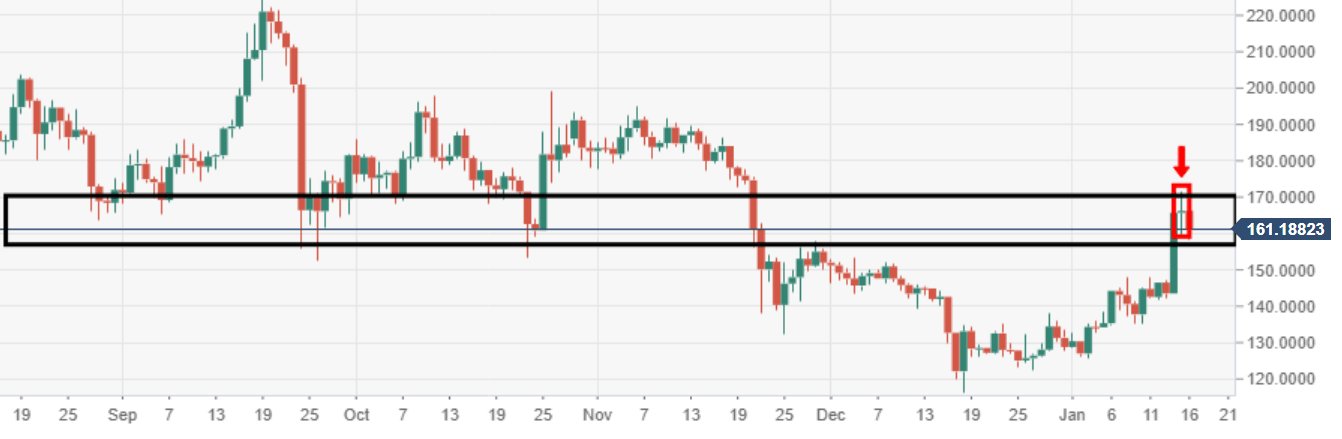
  • In terms next major zone of support, this is seen from a range of $160-150. 


ETH/USD daily chart

Price action via the daily expresses some vulnerabilities to the downside, given the recent doji candlestick formation.  

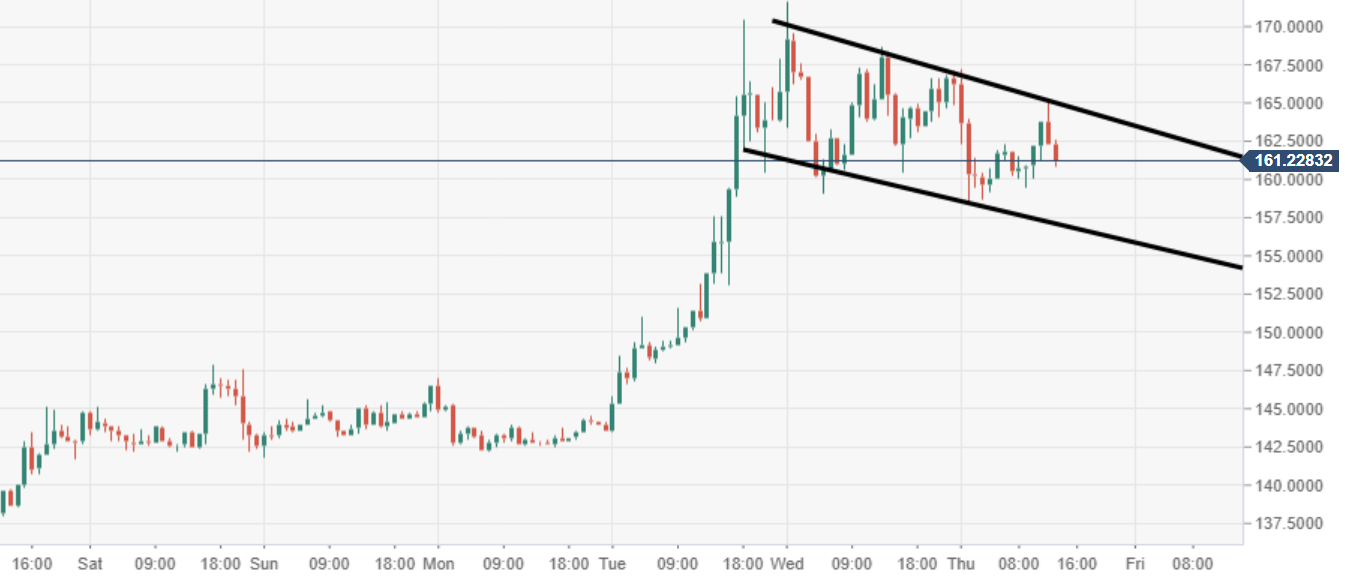
ETH/USD 60-minute chart

Despite the bearish doji candlestick closure on Wednesday, there is some hope of upside given the near-term flag structure. 


Spot rate:                    161.19               

Relative change:          -3.00%

High:                            167.16

Low:                             158.39


FX Street

FX Street

FXStreet is the leading independent portal dedicated to the Foreign Exchange (Forex) market. It was launched in 2000 and the portal has always been proud of their unyielding commitment to provide objective and unbiased information, to enable their users to take better and more confident decisions.