- Ethereum price is trading in the green by 0.10% in the session on Wednesday.
- ETH/USD has been rallying for four straight days, as the bulls maintain control.
- Momentum has remained solid following a bullish flag breakout.
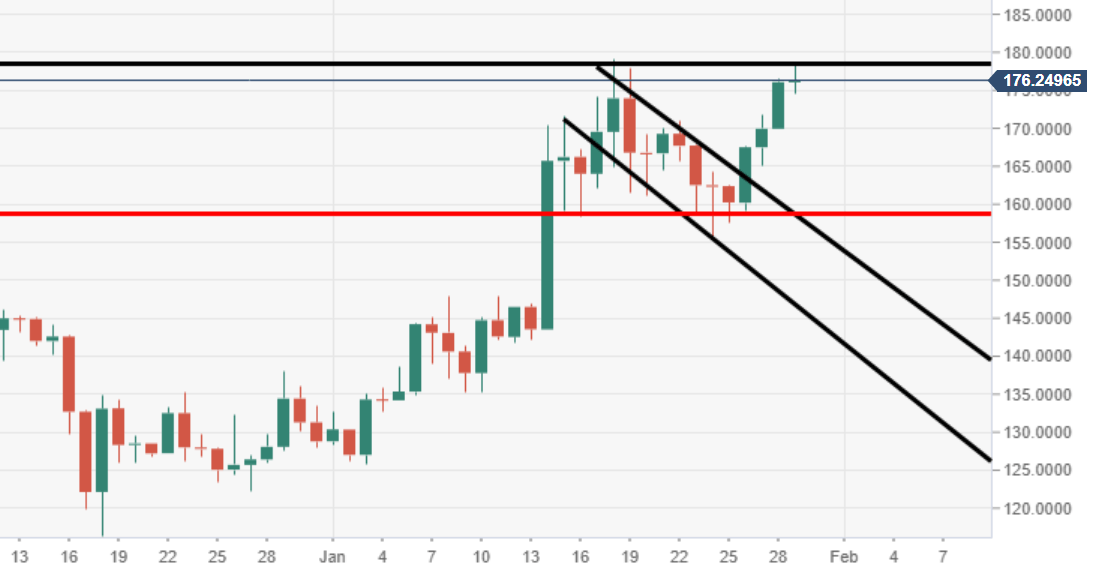
ETH/USD daily chart
The price is heading for a potential double top via the daily view, the bulls must force a daily breakout and closure above last week’s high area to cancel out the potential bearish setup.
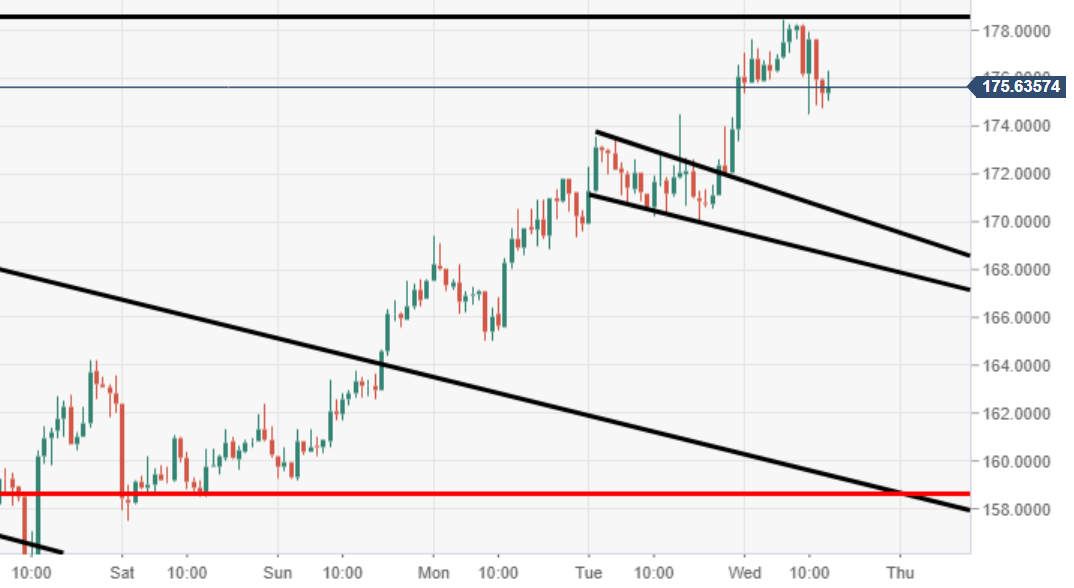
ETH/USD 60-minute chart
Near-term price action has smashed out of a bullish flag structure via the 60-minute, inviting a further wave of buying pressure. There runs the possibility of a retest down at $170.
Spot rate: 174.50
Relative change: +0.10%
High: 178.47
Low: 174.48
