- Bitcoin Cash price is trading in the green, with losses of 5.65% in the second half of the session.
-
BCH/USD price subject to a potential retest of a breached bullish flag structure via the daily.
-
Key daily support should be noted at $368, failure to hold, would invite a fresh wave of selling.
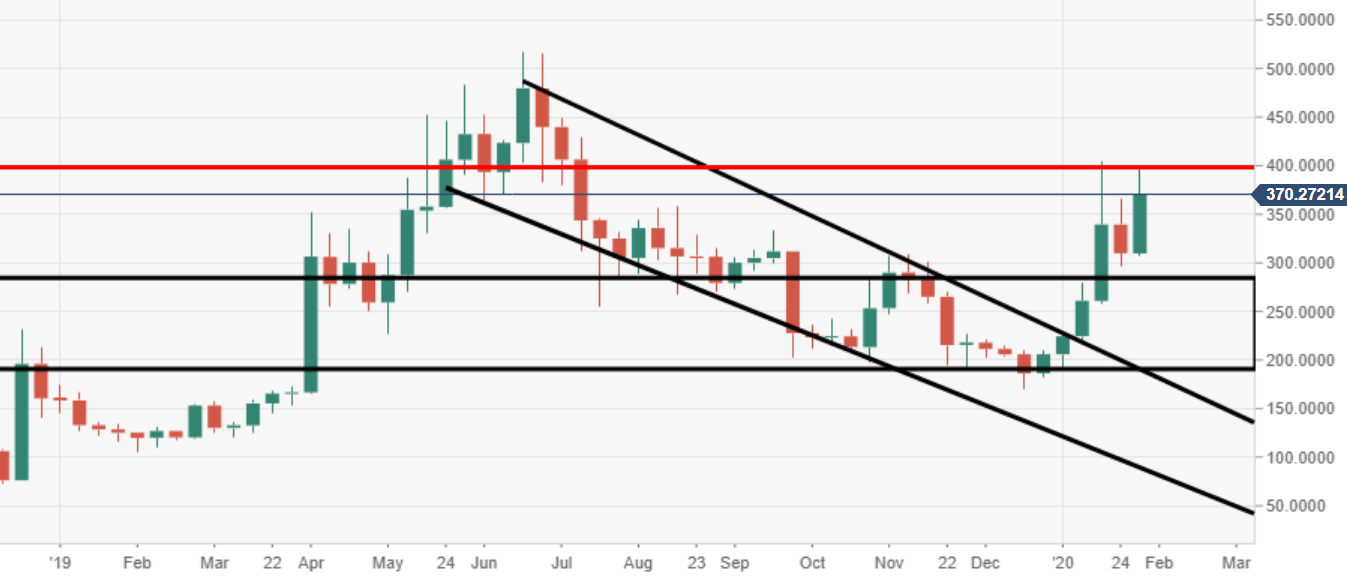
BCH/USD weekly chart
The bulls have made tremendous gains over the last six weeks, rallying from $185 up to recent highs at $400. Supply can be observed at the $400 mark, the major barrier ahead of $500.
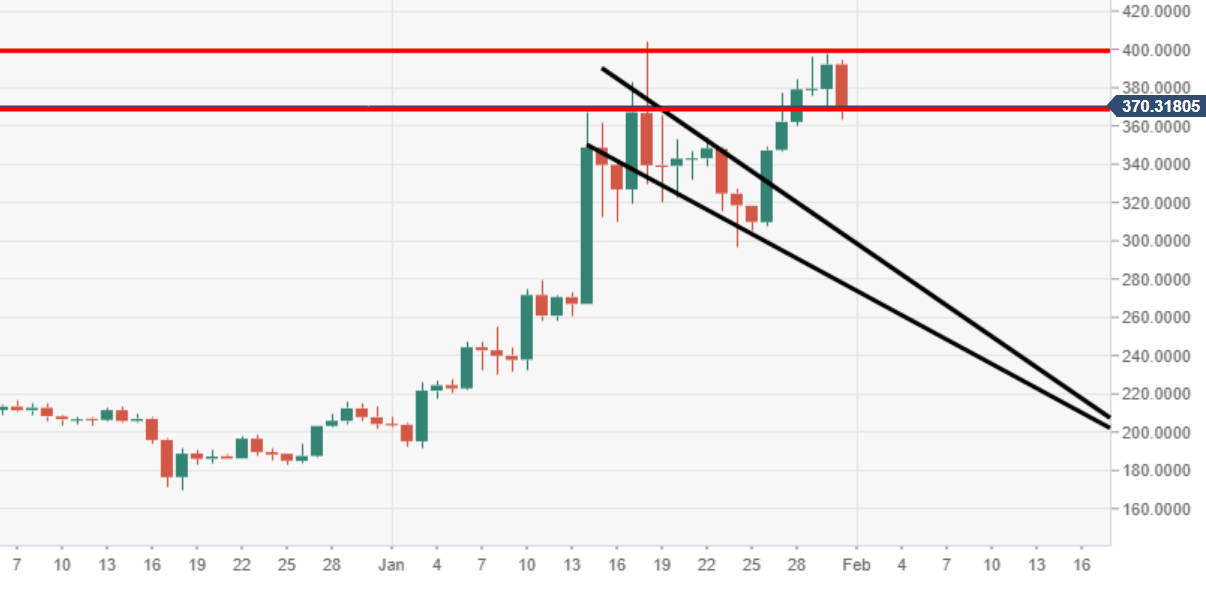
BCH/USD daily chart
BCH/USD has been on the run higher for five consecutive sessions, following a breakout of a bullish flag structure. Eyes are now on a potential retest, should the noted $368 support fail to hold.
Spot rate: 370.45
Relative change: -5.50%
High: 394.65
Low: 363.58
