- XRP price is trading in negative territory, with losses of some 3.60% on Monday.
- XRP/USD has begun to consolidate over the last five sessions, following a slight loss of upside momentum.
- Daily support should be noted at the range of $0.2700-0.2600.
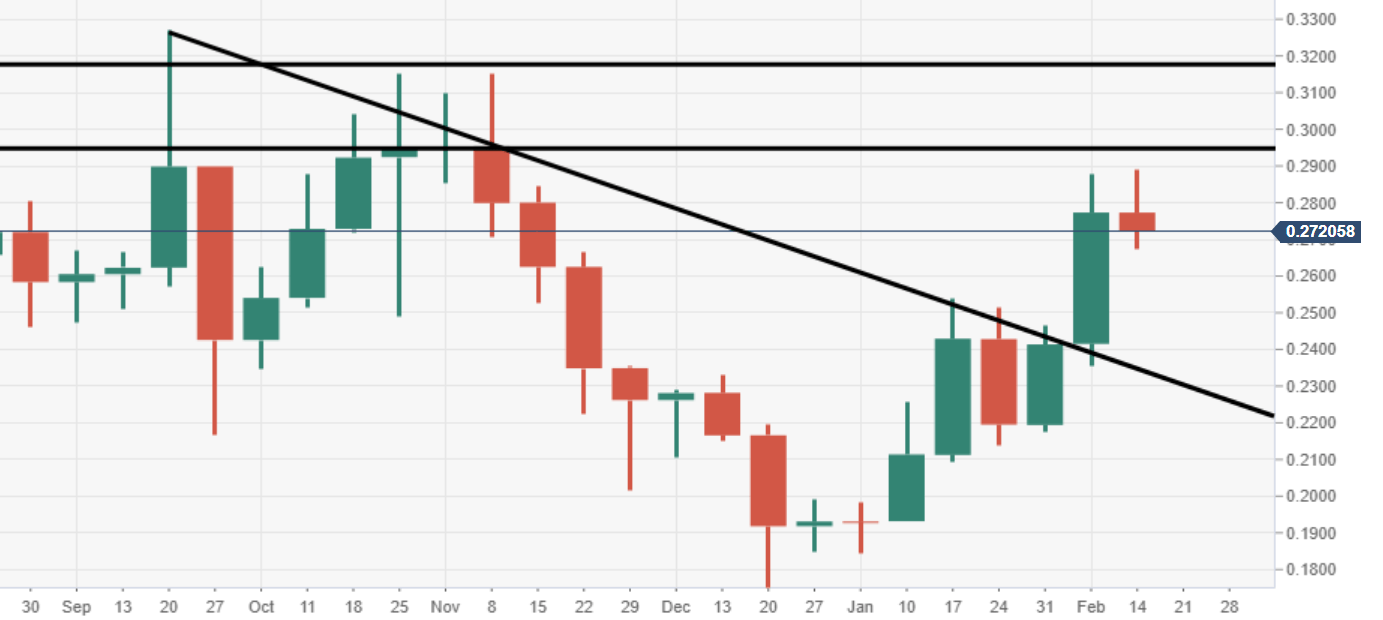
XRP/USD weekly chart
The bulls managed to force another week in positive territory, marking two consecutive weeks. XRP trades around the highest levels that have been seen since November 2019.
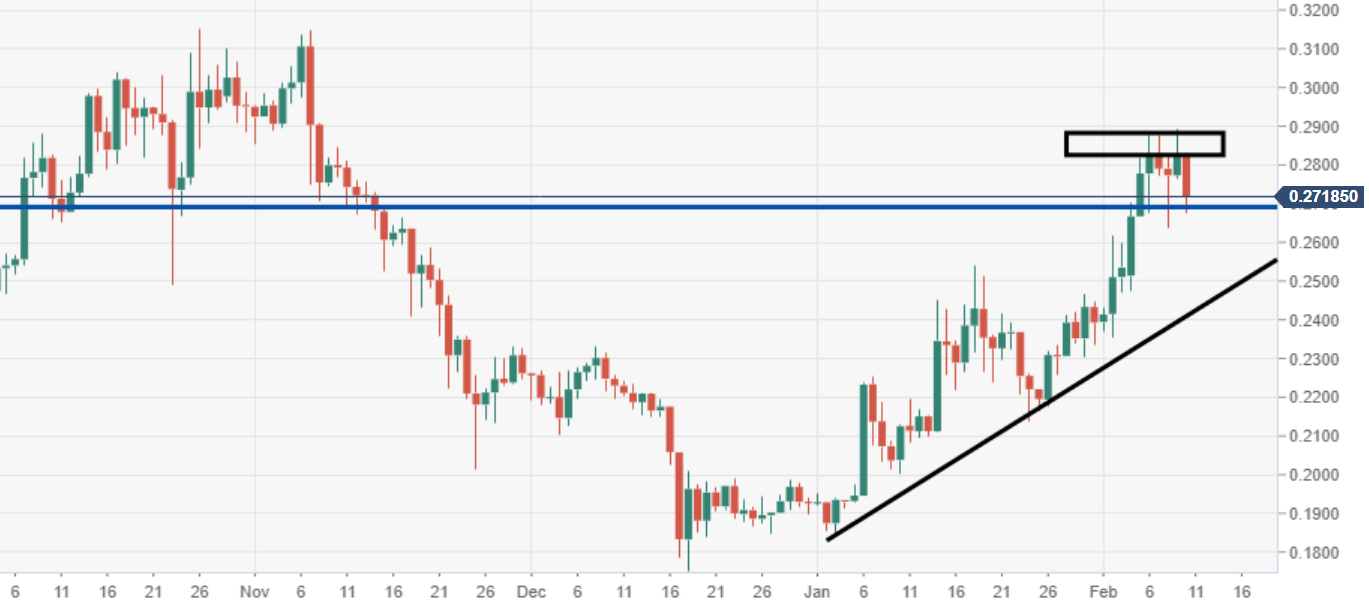
XRP/USD daily chart
Critical daily resistance can be observed at the range of $0.2800-0.2900, failure to break above could prove to be punishing.
Spot rate: 0.2791
Relative change: -3.60%
High: 0.2830
Low: 0.2674
