- The Elliott Oscillator has had 11 red sessions out of the last 12.
- The MACD indicator shows sustained bearish momentum.
DASH/USD daily chart
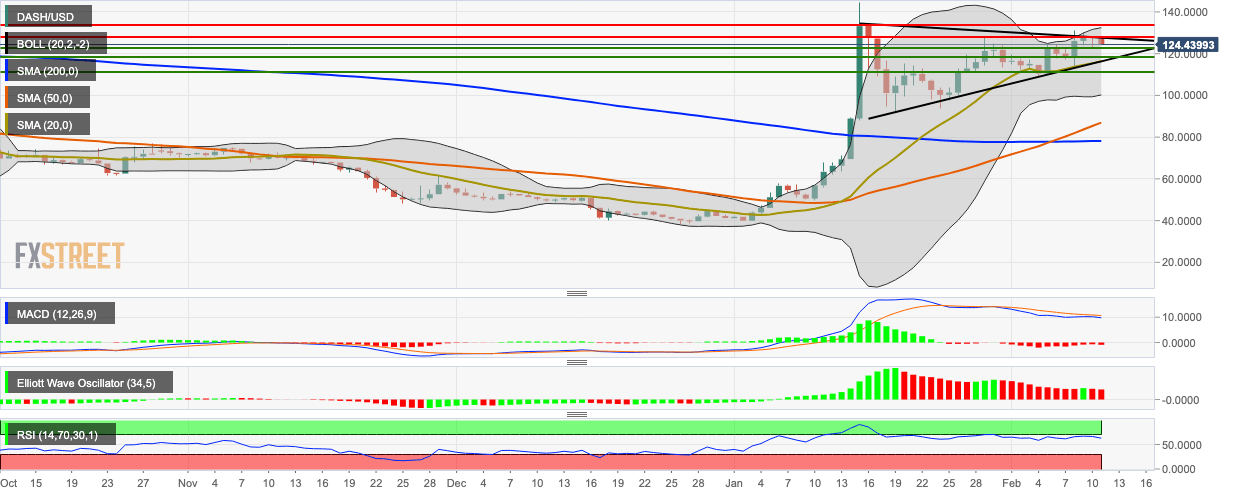
DASH/USD is trending in a triangular formation and hovering above the SMA 20, SMA SMA 50 and SMA 200 curves. DASH/USD has dropped from $128.20 to $124 since Monday after encountering resistance at the downward trending line. The 20-day Bollinger jaw is widening a bit, indicating increasing market volatility. The Elliott Oscillator has had 11 red sessions out of the last 12, while the RSI indicator has dropped from the edge of the overbought zone to 61.70. The signal line was looking to cross over the MACD line but has since diverged away to make sure that the overall market momentum remained bearish.
