- Bitcoin Cash price is trading in the red, with losses of 1.50% in the second half of the session.
- BCH/USD is maintaining decent heights despite the minor technical cooling observed.
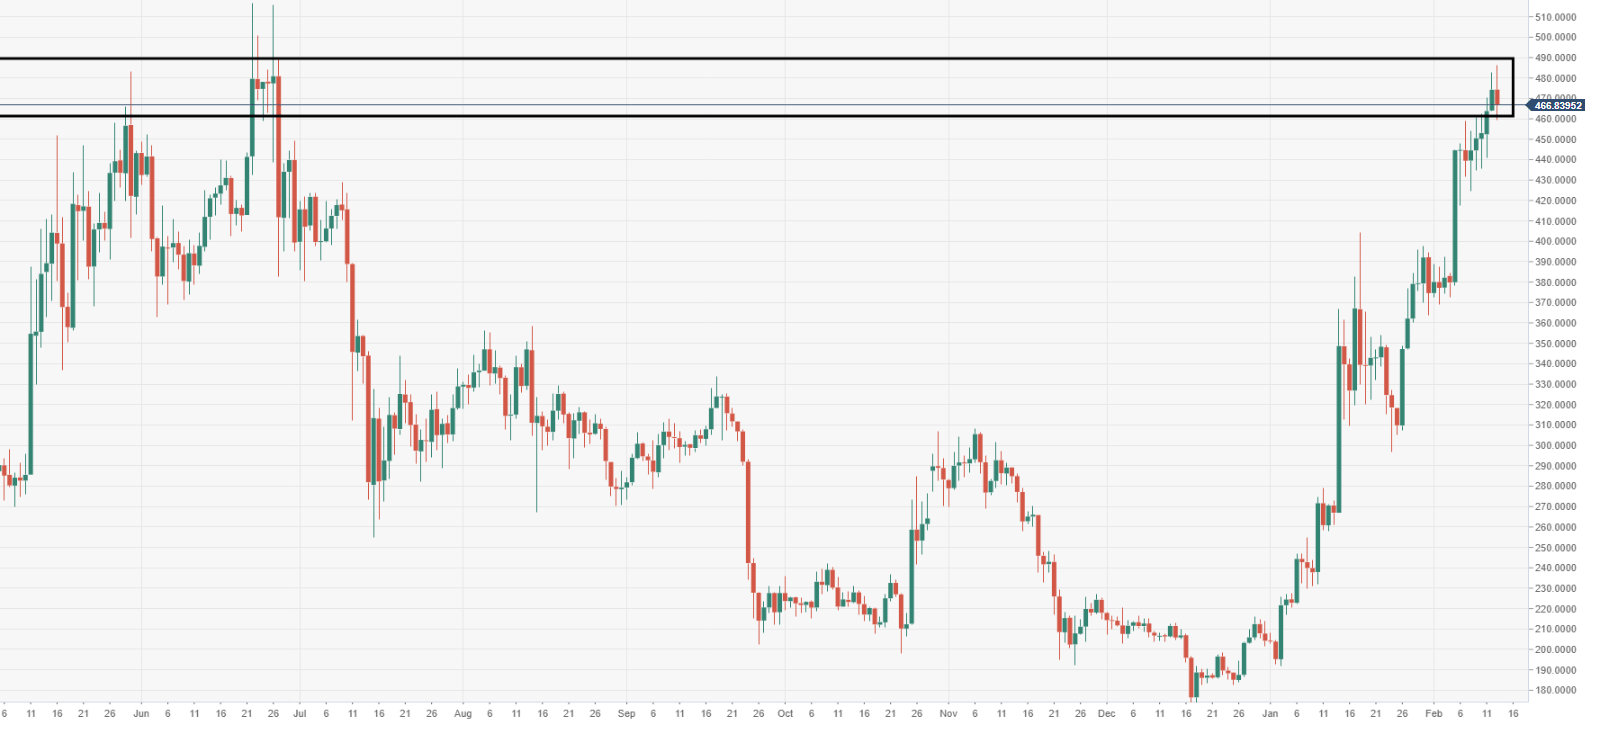
- A critical area of support should be noted at the range $460-440.
BCH/USD daily chart
Bulls have run into some supply around the high area in June 2019, where the price peaked.
BCH/USD 60-minute chart
The price has retested a breached range-block which the bulls broke out from during the session of 11 February.
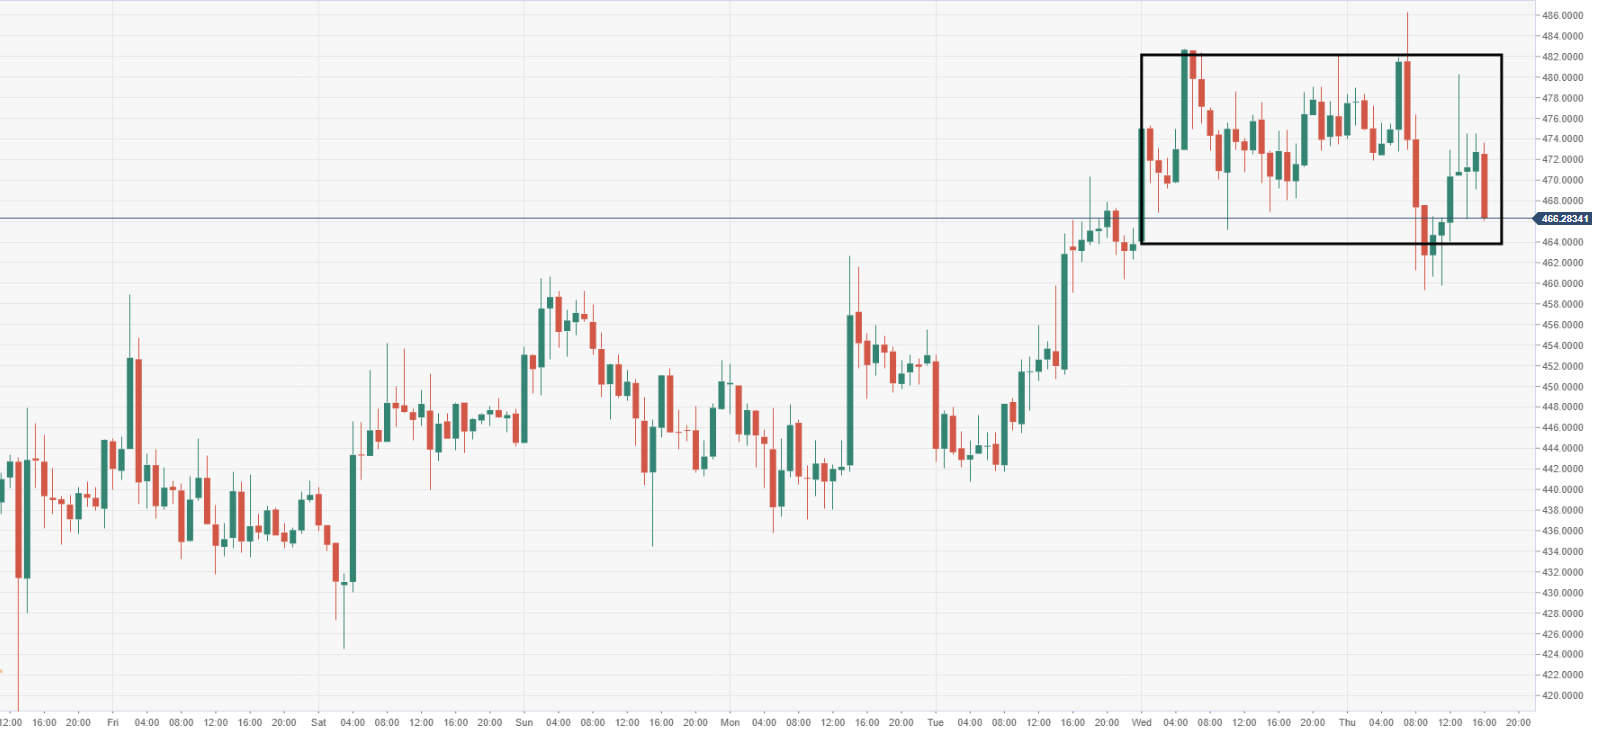
Spot rate: 466.86
Relative change: -1.50%
High: 486.34
Low: 459.36
