- BTC sellers return on Saturday amid profit-taking spree.
- Technical set up paints a bearish picture in the near-term.
- BTC/USD hit a new five-month high at 10,511.86 on Thursday.
The BTC sellers have regained control on Saturday, after attempting another test of a new five-month high reached at 10,511.86 last Thursday. Bitcoin (BTC/USD), the most favorite cryptocurrency, holds the lower ground on the 10k level, extending its recent consolidative mode. The spot, currently, exchanges hands at 10,240, losing 1.30% on the day while up nearly 4.50% on a weekly basis. Its market capitalization stands at to $186.27 billion, at the time of writing.
Technical Overview
BTC/USD hourly chart
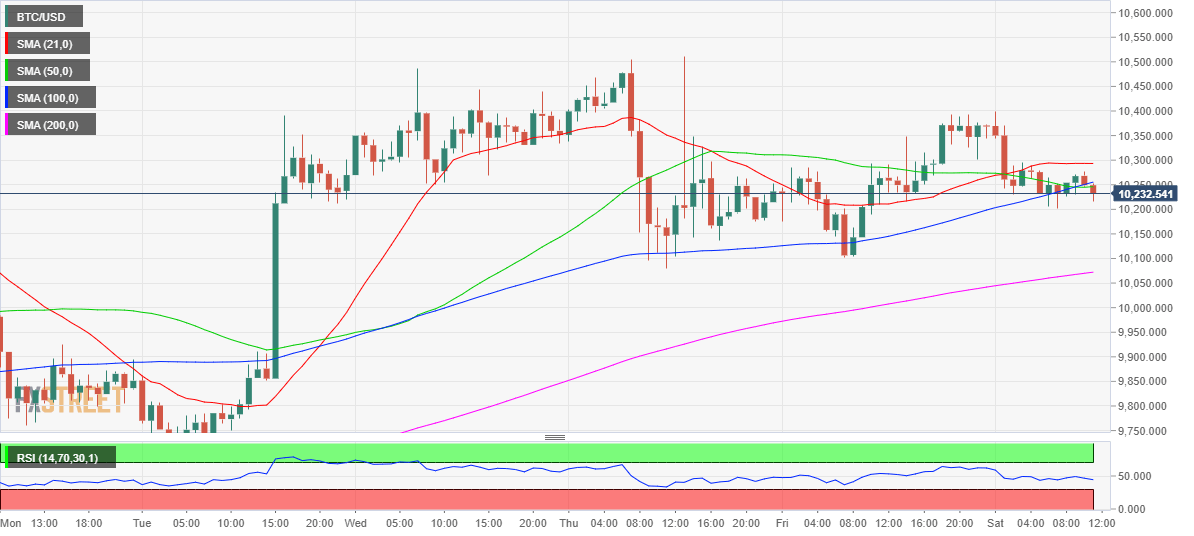
As observed in the hourly chart, the price wavers in a narrow range between 10,300-10,200 so far this Saturday, having witnessed a 180-pips steep drop in the overnight trades. Since then the price has kept its range below the 21-hourly Simple Moving Average (SMA), now at 10,293 levels. Only a sustained break above the latter would revive the bulls in the near-term, paving the way towards the multi-month tops.
However, the prices, as of now, continue to battle the key resistance located around 10,250, the confluence of the 50 and 100-HMAs. Meanwhile, the hourly Relative Strength Index (RSI) has breached the mid-line from above and points south, suggesting that the downside appears more compelling.
Also, the No.1 lacks significant support, as the bears now look forward to testing the next support of 200-HMA at 10,076, around which the buyers found support in the last two trading sessions.
BTC/USD key levels to watch
