- Bitcoin Cash price is trading in the red, with losses of 0.80% in the second half of the session.
- BCH/USD is set for another critical retest of daily support at the psychological $300 mark.
- Should the above-noted support be breached, a strong wave of downside would be eyed.
BCH/USD weekly chart
The price is running towards its third consecutive week in the red. It has very much been the case since the evening star formation in the week of 14 February, a strong signal provided for a reversal.

BCH/USD daily chart
Critical daily support should be noted at the $300 price mark, failure to hold could see a drop-down to $180, pre-2020 bull run levels.
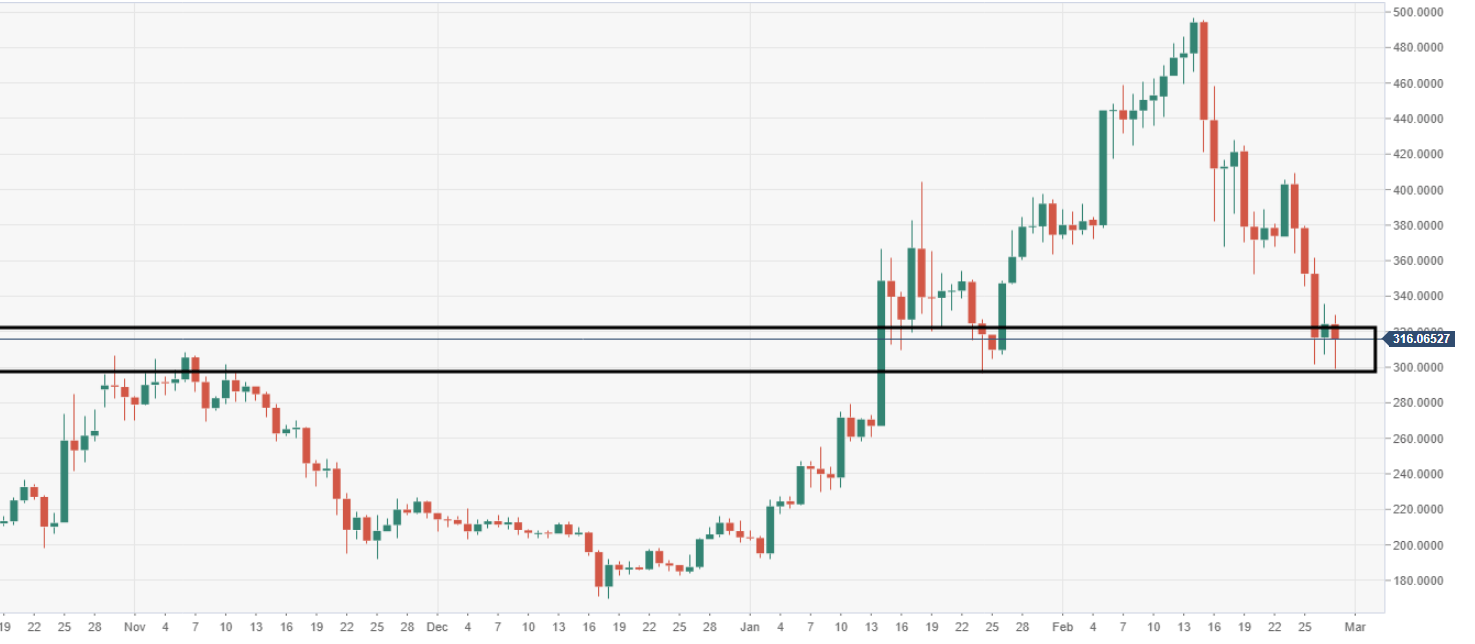
Spot rate: 316.05
Relative change: -0.50%
High: 329.59
Low: 299.03
