- The market bounced up from support at the SMA 200 curve.
- The RSI indicator is trending around 34.375 and the Elliott Oscillator has had four straight red sessions.
ETC/USD daily chart
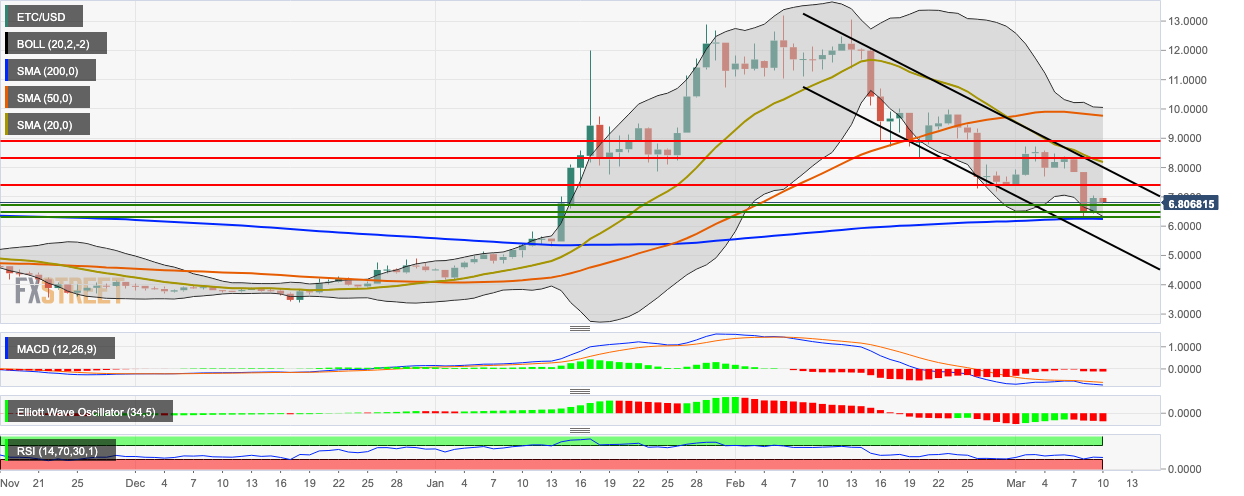
ETC/USD bulls ran out of steam near the $7-level and dropped from $6.96 to $6.84 in the early hours of Tuesday. The price is floating in a downward channel formation and below the SMA 20 and SMA 50 curves. The MACD indicates increasing bearish momentum, while the Elliott Oscillator has had four consecutive red sessions. Earlier this Monday, the price bounced up from the support provided by the SMA 20 curve to re-enter the 20-day Bollinger Band. The RSI indicator is trending around 34.375, next to the oversold zone, indicating that the market sentiment is presently bearish.
