- Bitcoin price is trading in negative territory, down 4.80% in the second half of the session.
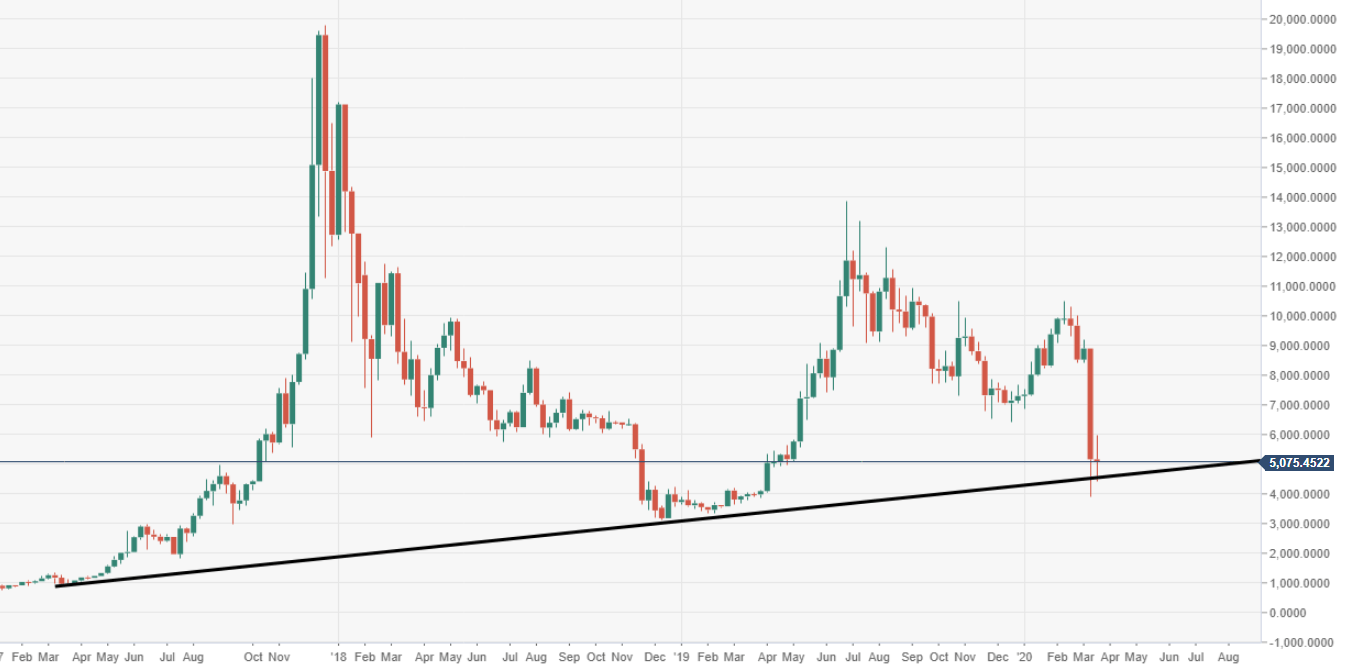
- BTC/USD has been falling since the deadly evening star formation in the week of 10 February.
- The price is back to trading at its worst levels since April 2019.
BTC/USD weekly chart
The price produced its worst weekly performance since December 2017, as the bears took strong control in driving the price south.
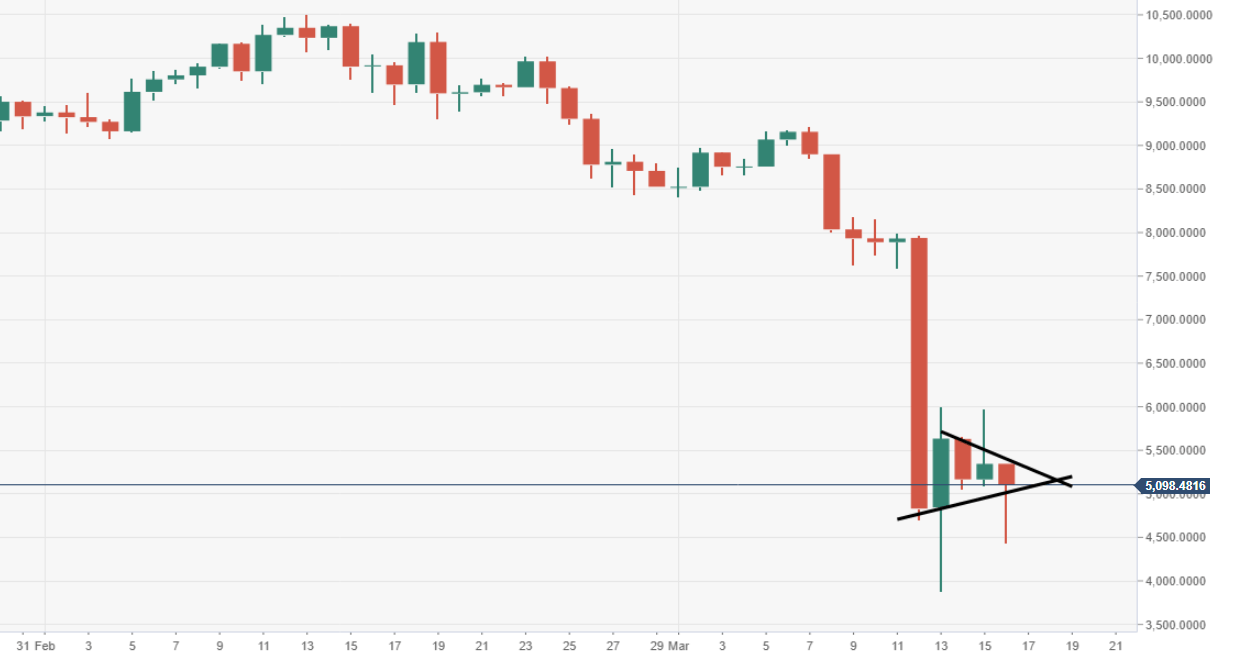
BTC/USD daily chart
Price action is narrowing within a bearish pennant structure via the daily chart view, at risk.
Spot rate: 5085.72
Relative change: -5.10%
High: 5348.72
Low: 4437.01
