- BTC/USD fell from $7,371 to $7,295 this Thursday.
- The RSI indicator has settled itself around 57.40.
BTC/USD daily chart
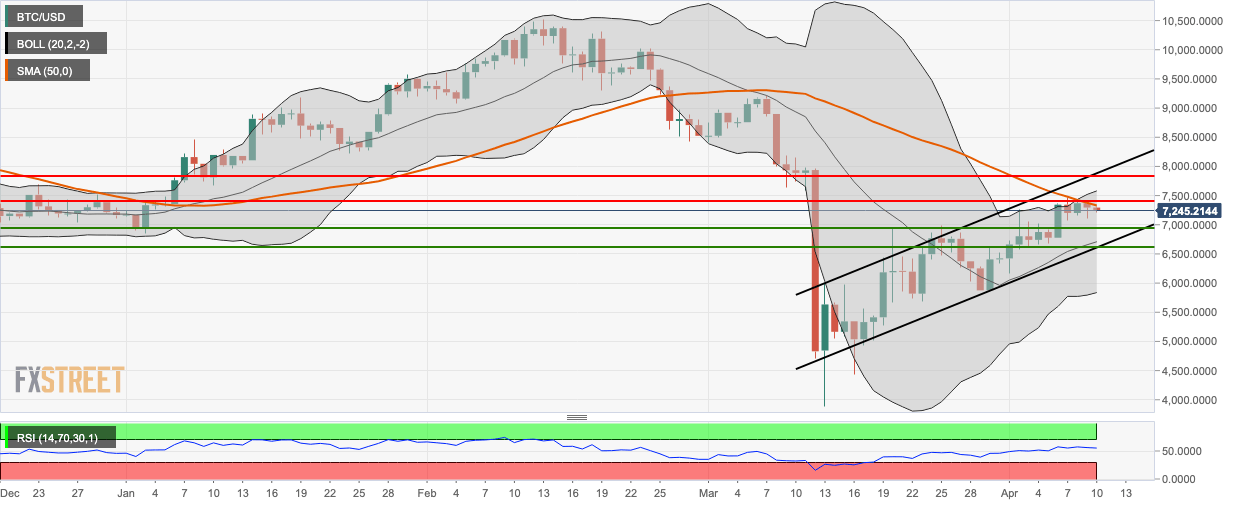
BTC/USD encountered resistance at the SMA 50 curve and charted two consecutive bearish days. The price of the asset has fallen from $7,295 to $7,241.35 in the early hours of Friday. Despite bearish action, the price is still trending in an upwards channel formation. If the bears want to continue their momentum, they will need to break support at $6,949.16 and then $6,629.67 to fall below the channel formation. The 20-day Bollinger jaw is slowly expanding, indicating increasing price volatility. The RSI is trending horizontally around the 57.40 mark.
Key levels
