- Bitcoin price is stable above $7,000 following the rally from levels under $6,500 last week.
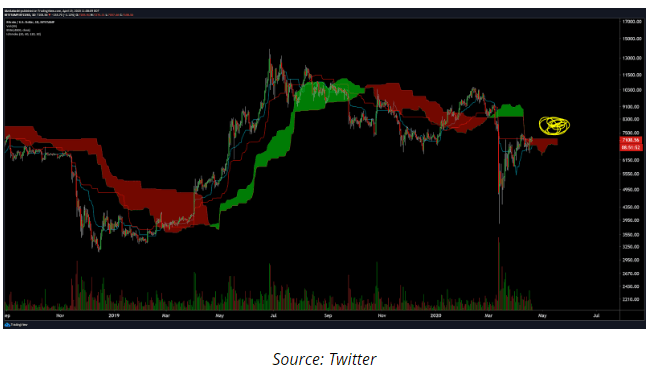
- BTC/USD is about to enter a unique buy zone after crossing above the Ichimoku Cloud.
The weekend session has been stable for most cryptocurrencies especially for Bitcoin. The bulls desire to close the week above $7,000 materialized with an opening value of $7,129. BTC/USD has remained in the green throughout the Asian session on Monday. At the time of writing, the largest digital asset is trading at $7,160 after adding a subtle 0.46% to its value on the day. The existing trend is bullish, although the low volatility suggest that very minor upwards movements are expected in the current session.
Bitcoin approaches halving
Bitcoin is grinding closer to the most-anticipated event not only for the network but also for the entire cryptocurrency industry. The May 2020 block reward halving happens to be third in the history of Bitcoin. Reward halving assists in controlling inflation of the asset as well as achieving its 21 million maximum supply. The previous two events were historically significant for BTC as they introduced volatility, reduced supply an increased demand; the perfect ingredients for a bull run.
Meanwhile, Bitcoin corrected from levels under $6,500 last week to highs close to $7,300. The asset has also sustained gains above $7,000. An Analyst with Brave new Coin, Josh Olszewicz believes that Bitcoin is almost entering a buy zone, which occurs once a quarter. According to the analyst, technically Bitcoin could soon climb above the Ichimoku Cloud for the first time in five weeks, giving way for another lift-off from the current levels above $7,000.
Bitcoin technical picture
Bitcoin price is stable above the moving averages where the 50 SMA and the 100 SMA have easily turned into support areas. The RSI is horizontal at 57 after retreating from highs around 70. The price is largely in the hands of the bulls as emphasized by the MACD. On the downside, other support areas include the ascending trendline, $7,000, $6,800 as well as $7,800. On the upside, a break above $7,200 resistance could result in boosted price movements targeting $7,500 in the near term.
BTC/USD 4-hour chart
%20(1)-637229480949474557.png)
