- BTC/USD bulls struggle to get the recovery back on track
- The technical picture implies that the upside may be resumed.
Bitcoin (BTC) hit a new April’s high $7,748 on April 23 and retreated to $7,500. Since that time, the first digital coin has been oscillating in a tight range limited by $7,000 on the upside and $7,500 on the downside. While BTC/USD retreated from the peak, many traders still expect further recovery amid growing concerns bout the monetary policy of global central banks.
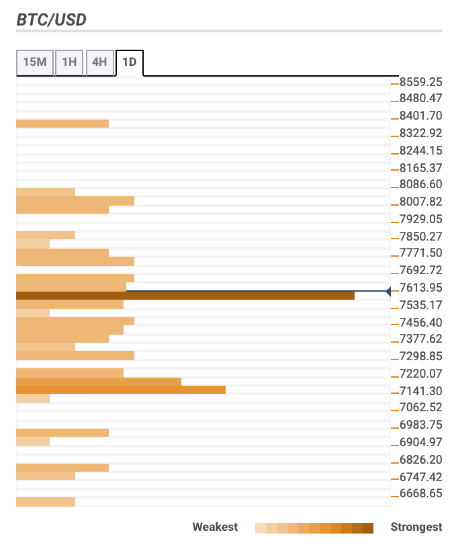
Bitcoin confluence levels
Technical barriers clustered both below and above the current price may keep BTC in the range for a while; however, the bullish scenario looks more likely at this stage. Let’s have a closer look at the technical levels for BTC/USD:
Resistance levels
$7,650 – the upper line of the daily Bollinger Band, 23.6% Fibo retracement daily
$8,000 – daily SMA200, Pivot Point 1-day Resistance 3
$8,350 – Pivot Point 1-week Resistance 2
Support levels
$7,450 – Pivot Point 1-day Support 1, the lowest level of the previous day
$7,200 – 61.8% Fibo retracement monthly, the lower line of the 4-hour Bollinger Band
$7,150 – the middle line of the daily Bollinger Band, 61.8% Fibo retracement weekly, daily SMA10, Pivot Point 1-day Support 3
BTC/USD, 1-day