- ETH/USD is the only one in the top three to be trending inside the 20-day Bollinger Band.
- Bitcoin’s Fear and Greed Index has moved from “Extreme Fear” to “Fear” following bullish price action.
Bitcoin, Ethereum, and Ripple took flight this Wednesday as bulls start consolidating their position pre-halving. So far, the bulls have remained in control and the price action of the coins look like this:
- BTC/USD has gone up from $8,790.08 to $8,831
- ETH/USD has gone up from $215.53 to $216.95.
- XRP/USD has gone up from $0.2265 to $0.2280.
Bitcoin Fear and Greed Index
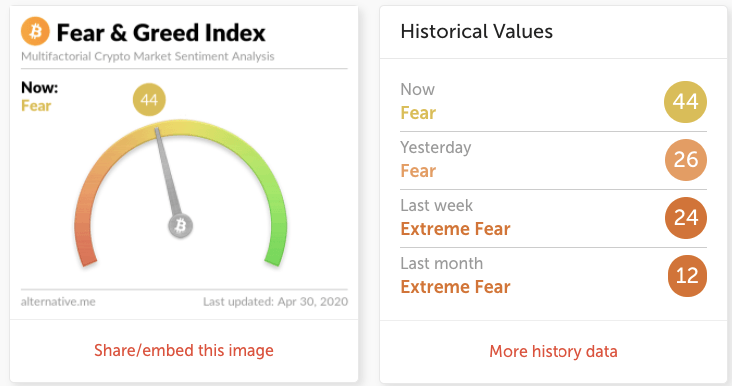
Alternative.me’s fear and greed index shows that Bitcoin has moved from “Extreme Fear” to “Fear” and is currently around 44. This indicates that the price of BTC/USD is no longer extremely undervalued but has more upside potential.
ETH/BTC daily chart
-637238118475891193.png)
ETH/BTC has had a bullish start to Thursday and is currently trending around the 0.02459 level and has found support on the SMA 20 curve. ETH/BTC had an extremely bearish Wednesday since BTC/USD outperformed ETH/USD over the day. On the upside, two resistance levels lie at 0.02486 and 0.02547. On the downside, ETH/BTC has two healthy support levels at 0.02455 and 0.02353. The MACD shows increasing bearish momentum.
BTC/USD daily chart
-637238118139452218.png)
BTC/USD flew up from $7,771.19 to $8,790.08, going above several key psychological levels like $8,000, $8,250, $8,500 and $8,750 and the SMA 200 curve, in the process. The price has jumped above the 20-day Bollinger Band and will be aiming for the $9,156.35 and $9,539.89 resistance levels. On the downside, the price has healthy support levels at $8,623.55 and $8,218.65. The MACD indicates increasing bullish momentum, while the RSI is hovering inside the overbought zone.
ETH/USD daily chart
-637238117613290387.png)
ETH/USD bulls remained in control in the early hours of Thursday as the 20-day Bollinger has widened enough to bring back the price inside the Band. On the upside, there are two strong resistance levels to overcome at $225.45 and $247.20. On the downside, there are two healthy support levels at $196.65 and $183.22. The Elliott Oscillator has had six straight green sessions, while the RSI is hovering at the edge of the overbought zone.
XRP/USD daily chart
-637238116964909056.png)
XRP/USD is trading around $0.228 and has found resistance at the SMA 200 curve and is hovering above the 20-day Bollinger Band. If the bulls cross above the SMA 200, there are two resistance levels to overcome at $0.235 and $0.2453. On the downside, the price has two healthy support levels at $0.224 and $0.212. The RSI is inside the overbought zone.
