- The Elliott Oscillator has had five straight red sessions.
- The 20-day Bollinger jaw has narrowed, which indicates decreasing price volatility.
BTC/USD daily chart
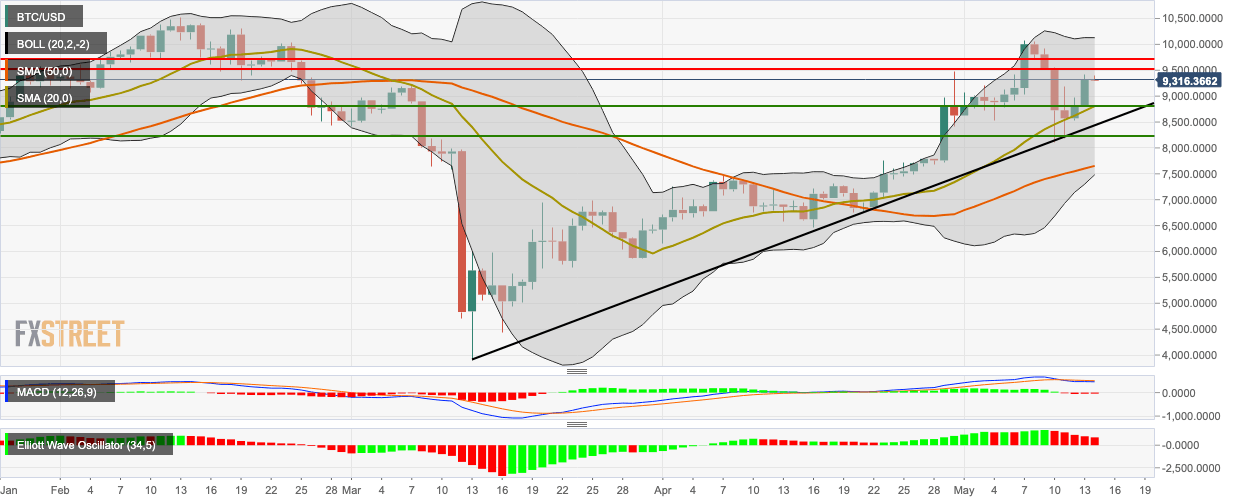
BTC/USD dropped a bit from $9,320 to $9,303 following a hugely bullish Wednesday. The Elliott Oscillator has had five straight red sessions, while the MACD shows sustained bearish momentum. The 20-day Bollinger jaw has narrowed, which indicates decreasing price volatility.
The price faces two resistance levels on the upside at $9,500 and $9,735. On the downside, there are two healthy support levels at $8,815.35 and $8,214.40.
Key levels
