- Bitcoin showed a mixed price reaction after halving on May 11th.
- BTC/USD remains on track to close second straight month higher.
After halving for the third time in 11 years on May 11th, Bitcoin’s (BTC/USD) price rose nearly 14% in the next three days but lost its momentum before breaking above the critical $10,000 mark. During the third week of the month, the pair staged a correction and briefly dipped below $9,000.
Nevertheless, Bitcoin didn’t have a difficult time reversing its direction and against and now looks to close the month around 10% higher near $9,500. Since the beginning of April, the pair is up nearly 45%.
Technical outlook
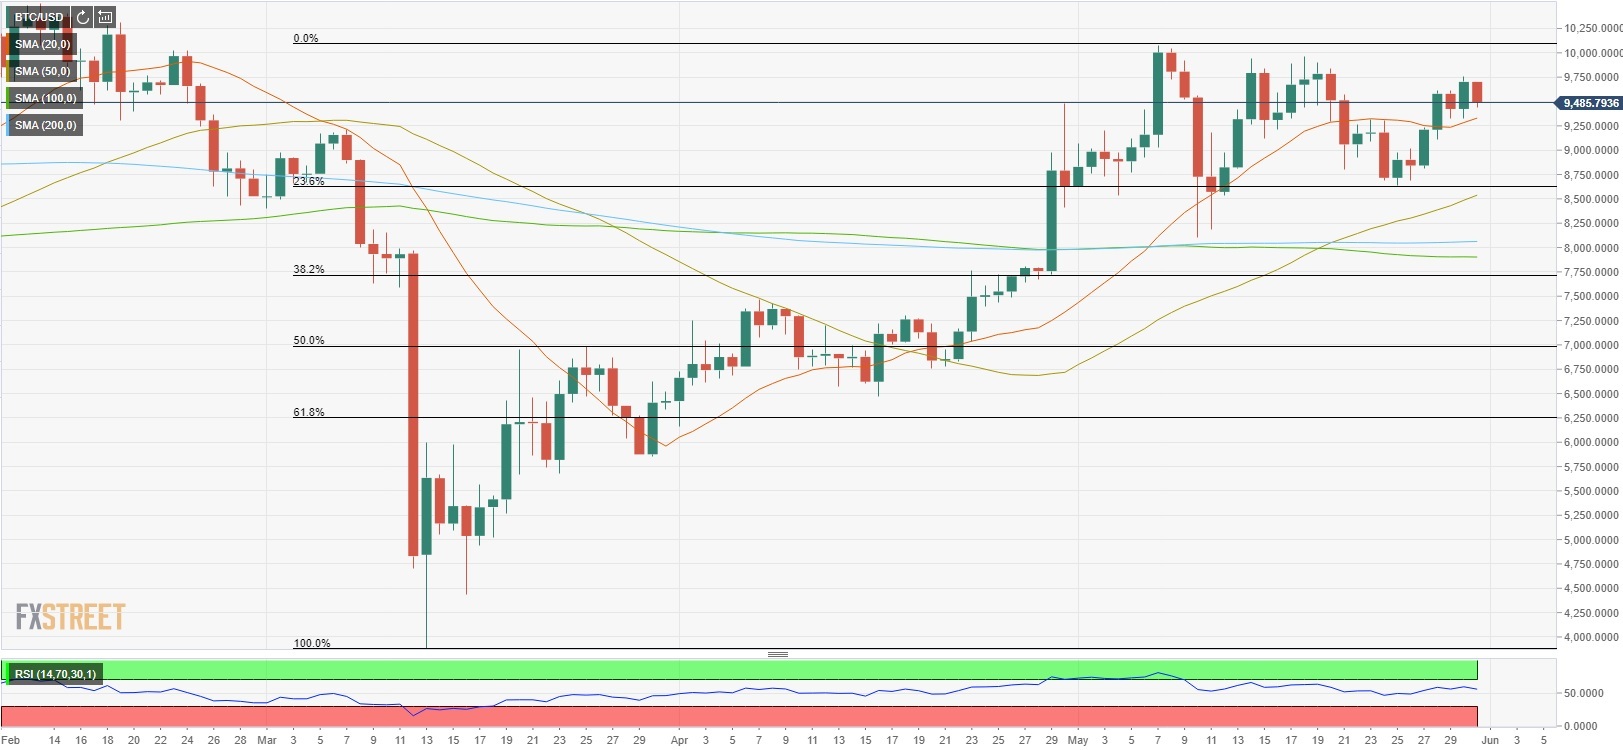
Looking at the daily chart, BTC/USD seems to be consolidating in a relatively wide range between $8,650 (Fibonacci 23.6% retracement of March 13 – May 17 uptrend) and $10,000 (psychological level). The next decisive move is likely to come after the price successfully breaks out of this channel.
Ahead of $10,000, $9,700 (Saturday’s daily closing level) and $9,8000 (static level) could be seen as interim resistances. On the downside, $9,300 (20-day SMA) and $9,000 (psychological level) could act as near-term support levels. Meanwhile, the daily RSI is also moving sideways a little above 50 to confirm the near-term neutral-outlook.
BTC/USD daily chart