- NANO/USD is up 15% going from a low of $1.08 to a high of $1.29 in the last 24 hours.
- Nano is really close to the 2020-high of $1.31 established on June 10.
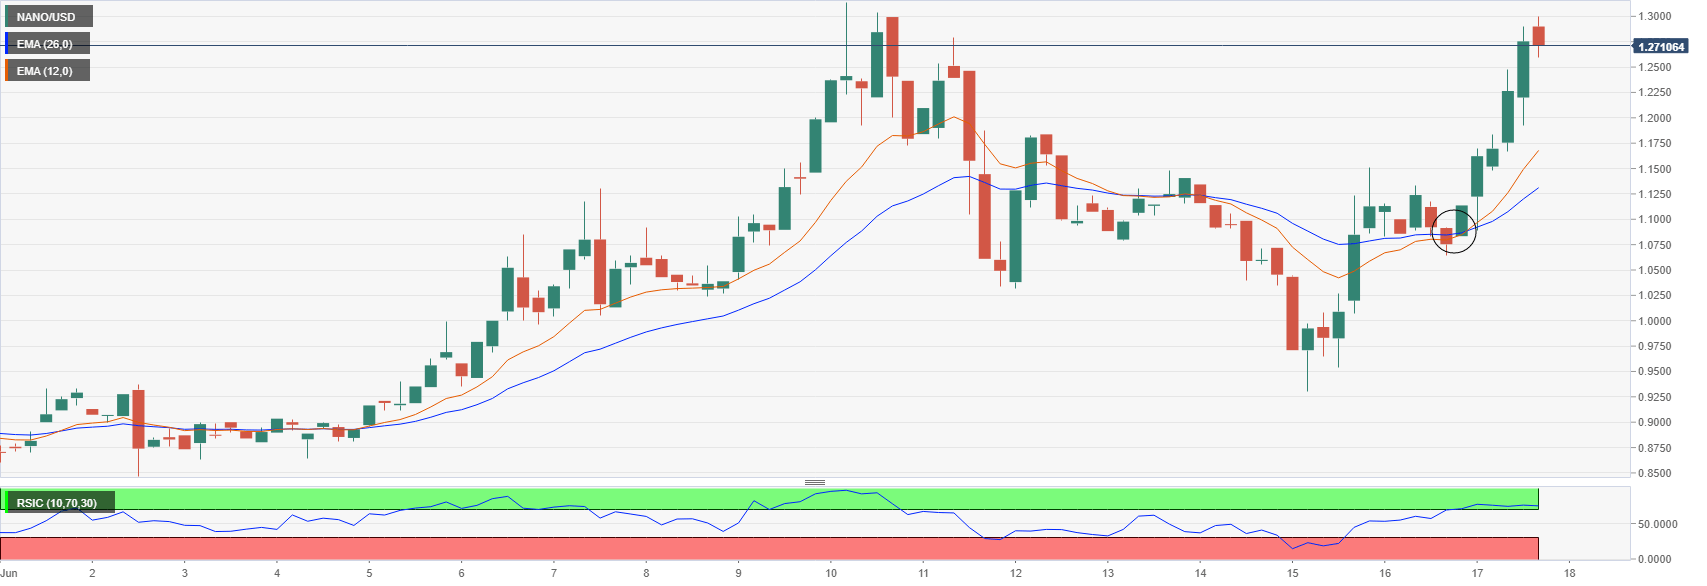
Nano is trading inside a robust daily uptrend and it’s outperforming Bitcoin and the rest of altcoins. Bulls defended the daily 12-EMA at $1.06 on June 15 and formed a strong bullish reversal candlestick. Nano is only inches away from a new 2020-high and the RSI is not overextended.
NANO/USD daily chart
-637280092142547720.png)
The strong uptrend is still in play for Nano and buyers are looking at $1.31, the last daily high. There is really not a lot of resistance after the 2020-high and Nano could easily crack $1.5 and even $2 within weeks. The daily RSI is only at 64 points, which is pretty low considering the magnitude of the bull run.
The daily 12-EMA at $1.1 will act as a support level if needed and the 26-EMA at $1.01 will be the fail-safe.
NANO/USD 4-hour chart
It’s not surprising to see Nano in a 4-hour uptrend, but the RSI is overextended and could slow down the bulls in the short-term. The 12-EMA and the 26-EMA crossed bullishly on June 16 and Nano is currently trading way above any of them.
