- Ethereum fell below 50-day SMA for the first time since mid-April.
- ETH/USD is losing more than 3% for the week.
Ethereum (ETH/USD) moved sideways near $230 on Saturday but fell sharply in the second half of the day. After slumping to its lowest since late May at $216, ETH/USD has gone into a consolidation phase and was last seen trading around $220, where it was unchanged on the day. With Saturday’s drop, Ethereum turned red for the week and now looks to close in the negative territory for the third straight day.
Ethereum technical outlook
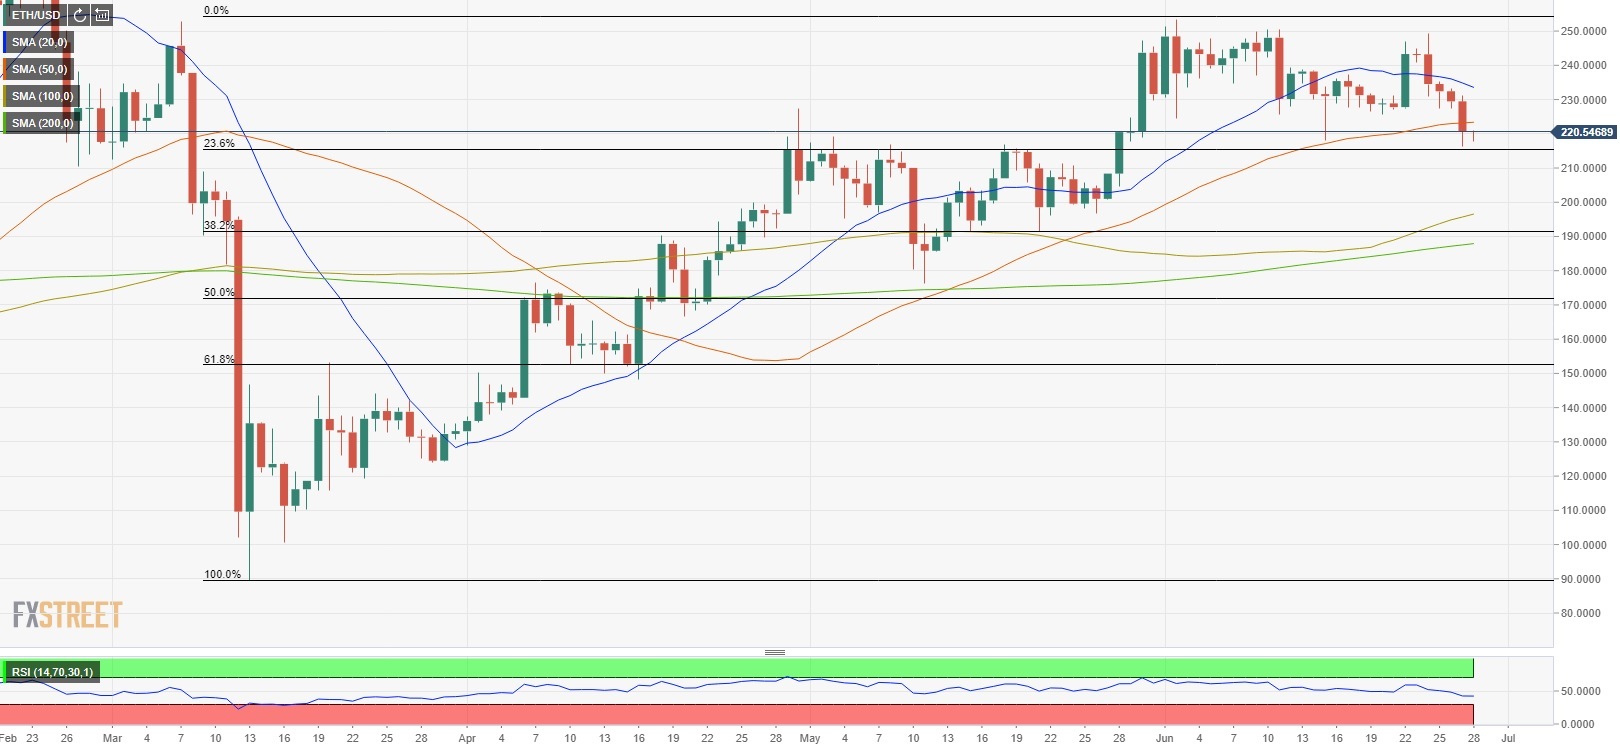
Ethereum broke below the 50-day SMA for the first time since mid-April, suggesting that the outlook turned bearish in the near-term. Moreover, the RSI on the daily chart continues to push lower below 50.
The Fibonacci 23.6% retracement level of the three-month-long rally that started in March could be seen as the next support at $215. Below that level, Ethereum could target $200. On the upside, resistances are located $223 (50-day SMA), $233 (20-day SMA) and $250 (upper limit of the three-week-old horizontal channel).