- XRP/USD is one of the most lethargic coins out of top-20.
- The price needs to clear iether $0.1700 or $0.1800 to bring excitement.
XRP/USD has stalled in a tight range limited by $0.1700 on the downside and $0.1800 on the upside. The coin has stayed mostly unchanged both on a day-to-day basis and since the beginning of Thursday, moving in a tight channel with the short-term bullish bias amid high volatility. Ripple’s XRP is the fourth largest digital asset with the current market value of $7.8 billion and an average daily trading volume of $1.11 billion.
XRP/USD: Technical picture
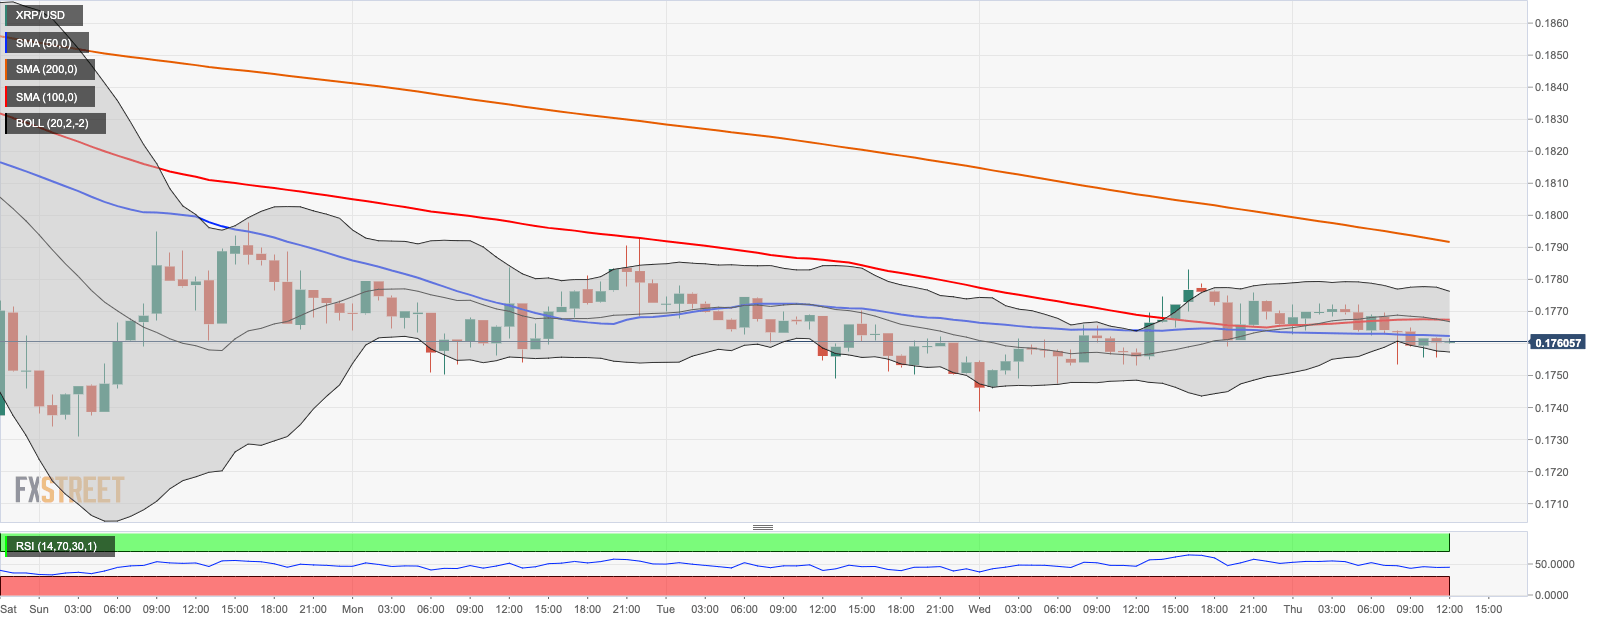
On the intraday chart, XRP/USD is staying close to the 1-hour SMA50 (currently at $0.1760). The local resistance is created by a combination of the middle line of the 1-hour Bollinger Band and 1-hour SMA100 at $0.1770). It is followed by 1-hour SMA200 at $0.1790 and psychological $0.1800 that has been limiting the recovery for the best part of the week. Once this barrier is out of the way, XRP/USD may jump towards $0.1850 ( the middle line of the daily Bollinger Band) and $0.1950. This is a stronger barrier created by a combination of daily SMA100 and SMA50.
XRP/USD 1-hour chart
On the downside, the initial support is created by the lower line of the daily Bollinger Band at $0.1720 and the psychological level of $0.1700. If the price moves bellow this area, the bearish pressure may increase with the next focus on $0.1691, which is the lowest level of the previous week. The RSI on a daily chart stays flat, close to the oversold level, which means, XRP is more likely to gain ground within the current range channel.
XRP/USD daily chart
-637292896426288143.png)
