- XTZ/USD bears stepped in following three straight bullish days.
- William’s %R dipped from the overbought zone following Thursday’s bearish price action.
XTZ/USD daily chart
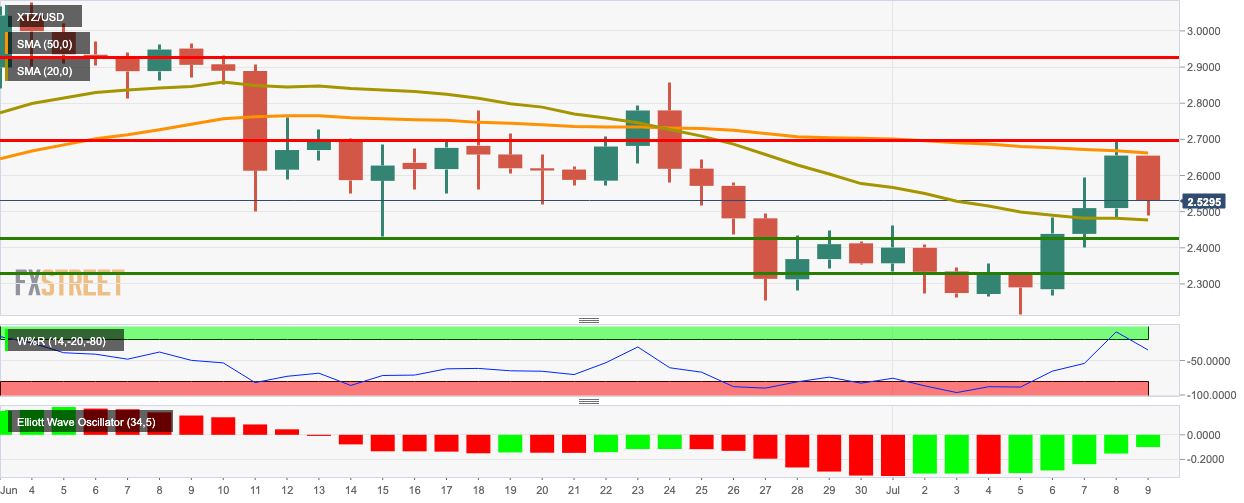
XTZ/USD fell from $2.652 to $2.546 as the bears stepped back into the market following three straight bullish days. The sellers are on course to negate Wednesday’s gains. The price is sandwiched between the SMA 50 and SMA 20 curves. William’s %R dipped from the overbought zone following Thursday’s bearish price action. Finally, the Elliott Oscillator has had five straight green sessions, showing that overall market sentiment is still bullish.
Support and Resistance
XTZ/USD faces strong resistance at $2.925, $2.698 and $2.664 (SMA 50). On the downside, good support lies at $2.48 (SMA 20), $2.426 and $2.33.
