- KNC/USD’s recent consolidation was extended for a while but remains healthy.
- KNC’s bullish momentum is still strong and the daily RSI has cooled off.
In our recent Kyber Network article we discussed the health of the consolidation. Days later, KNC is still under the same consolidation defending the $1.55 several times in a row. The trading volume has continued to decline every day but the RSI has cooled off.
KNC/USD daily chart
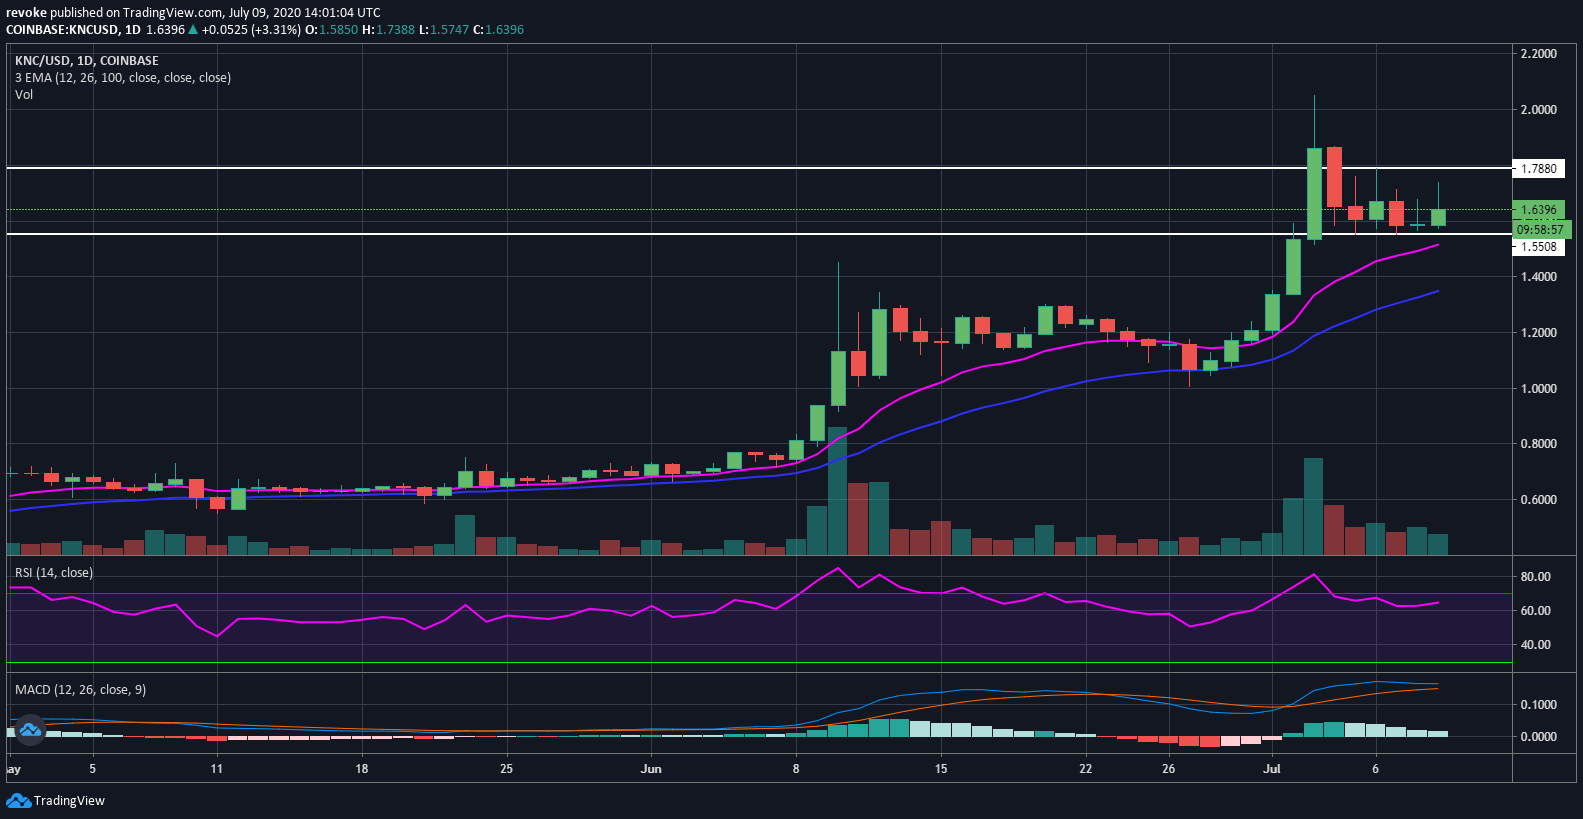
The daily 12-EMA at $1.51 hasn’t even been touched yet but can still serve as a support level in case $1.55 falls. Bulls only find resistance at $1.7892 and then $2 which is their next aim. The daily RSI has cooled off but it’s still high, however, it won’t necessarily stop the bulls from cracking $2 if the momentum is strong enough.
KNC/USD 4-hour chart
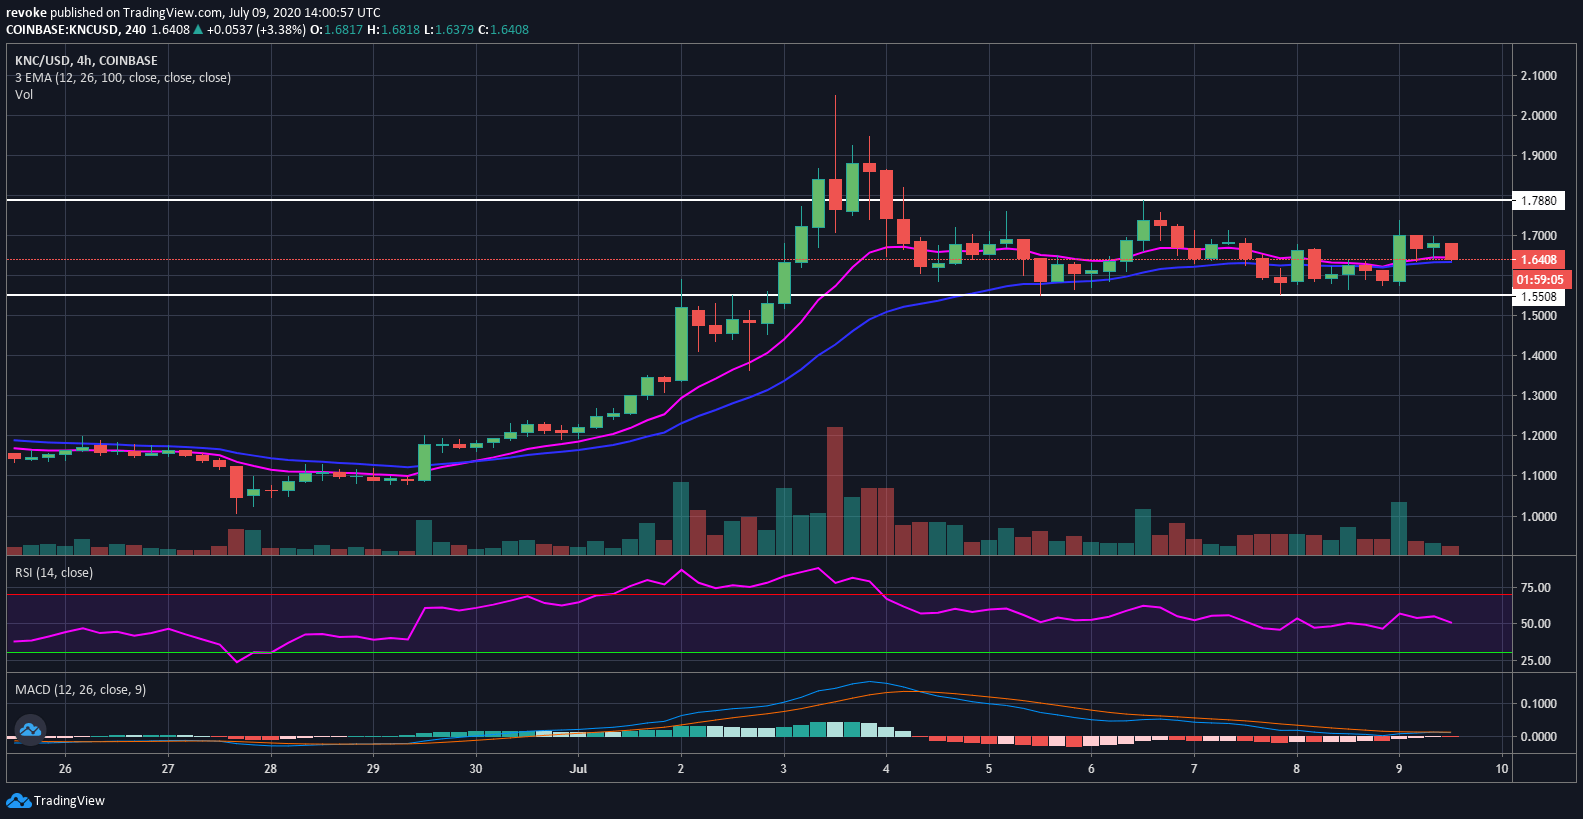
Not a lot is happening on the 4-hour chart as KNC has been trading sideways for the past few days. The most important level here is also $1.789 and the MACD is on the verge of a bull cross.
