- Verge price is currently at $0.0059 after a significant pullback.
- The daily chart is now in a downtrend and extremely weak.
Verge has finally succumbed to the selling pressure caused by the huge bull rally towards $0.01. Unfortunately, XVG lost the daily uptrend and has dropped below both daily EMAs which have crossed bearishly for the first time since February 2020.
XVG/USD daily chart
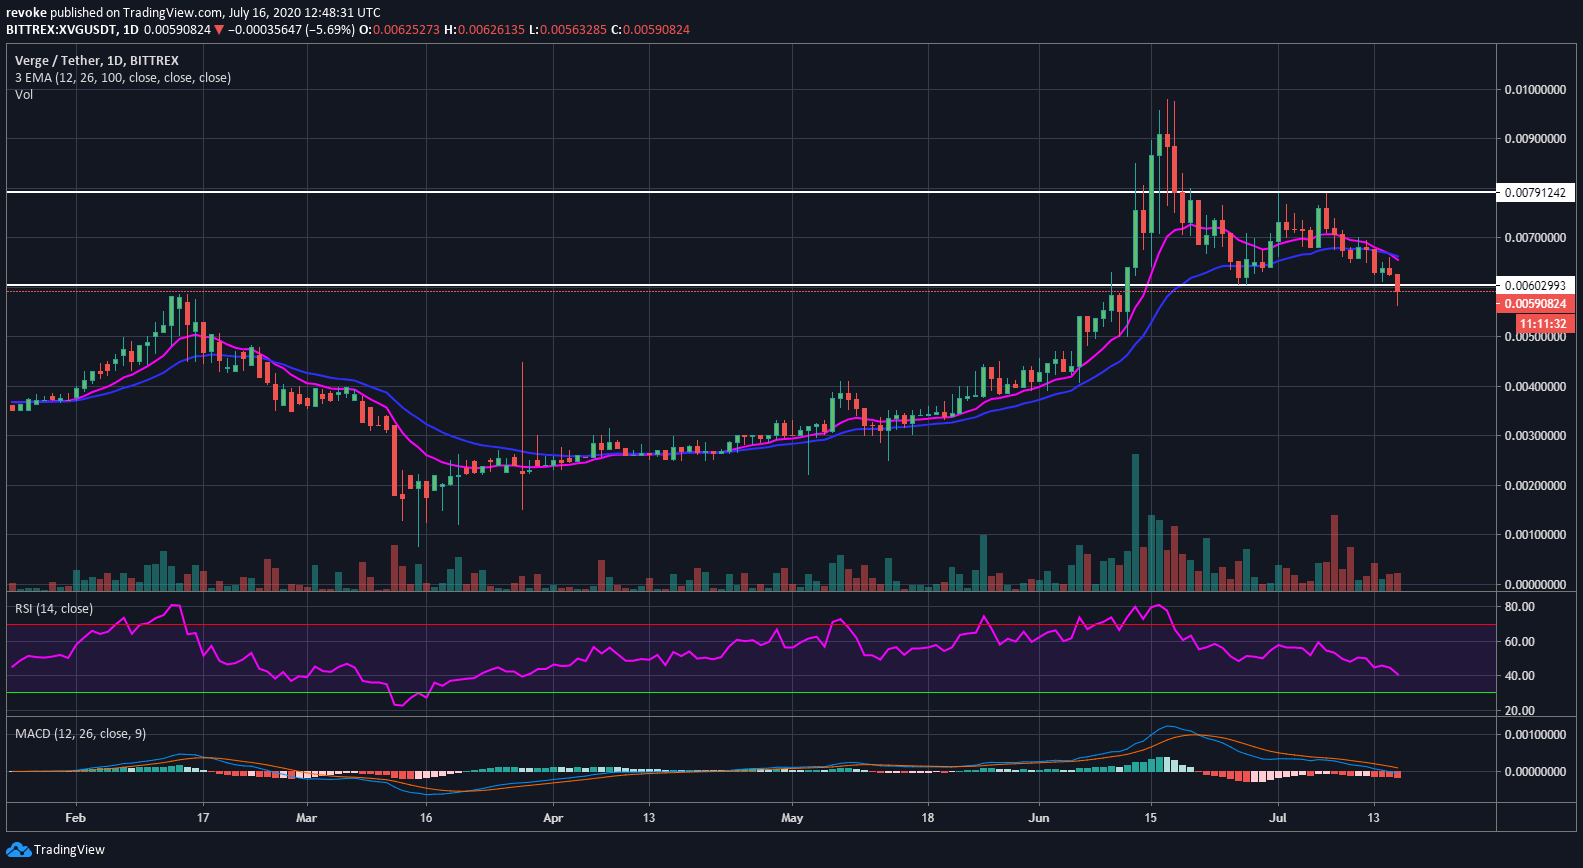
As mentioned above, the daily chart is in a downtrend and bulls don’t have many support levels nearby. The next support point is located at $0.005 but the daily RSI might reach oversold levels before that. The last time we saw the daily RSI being oversold was on March 13 when Verge price bounced significantly.
