- XRP/USD bulls look to take back the $0.29 resistance level.
- RSI trends along horizontally at 62.50.
XRP/USD daily chart
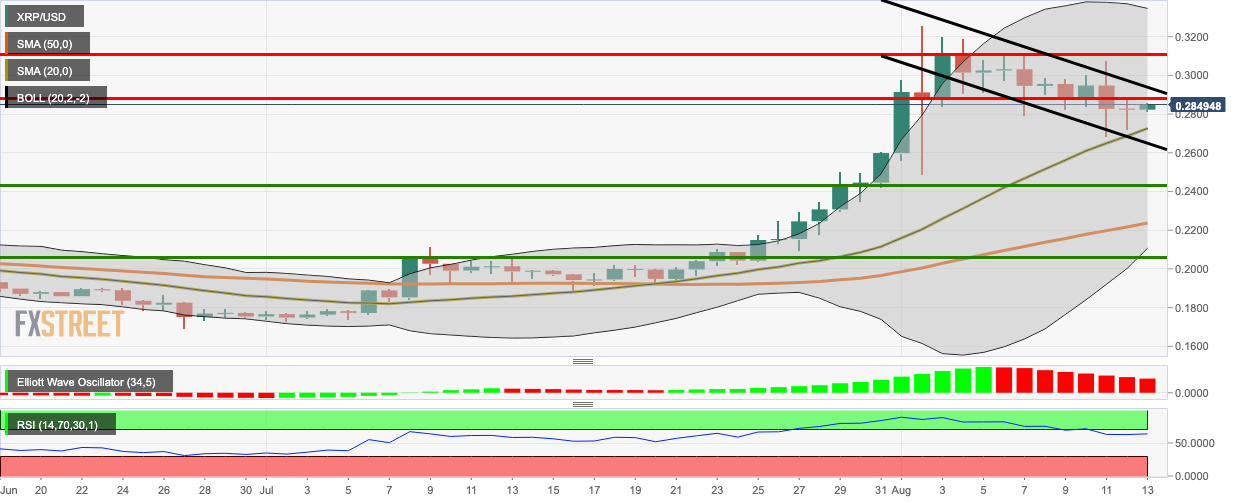
XRP/USD bulls stage a comeback following two bearish days, taking the price up from $0.2822 to $0.2850. The buyers aim for the $0.29 resistance level as the price keeps trending in a downward channel formation. The relative strength index (RSI) keeps trending horizontally around 62.50, right next to the overbought zone.
XRP/USD has two strong resistance levels at $0.29 and $0.311. On the downside, we have four healthy support levels at $0.273 (SMA 20), $0.243, $0.224 (SMA 50) and $0.206.
Key levels
