- XRP/USD faces bearish correction following bullish Monday.
- There are two strong resistance levels at $0.2954 (SMA 20) and $0.3103.
XRP/USD daily chart
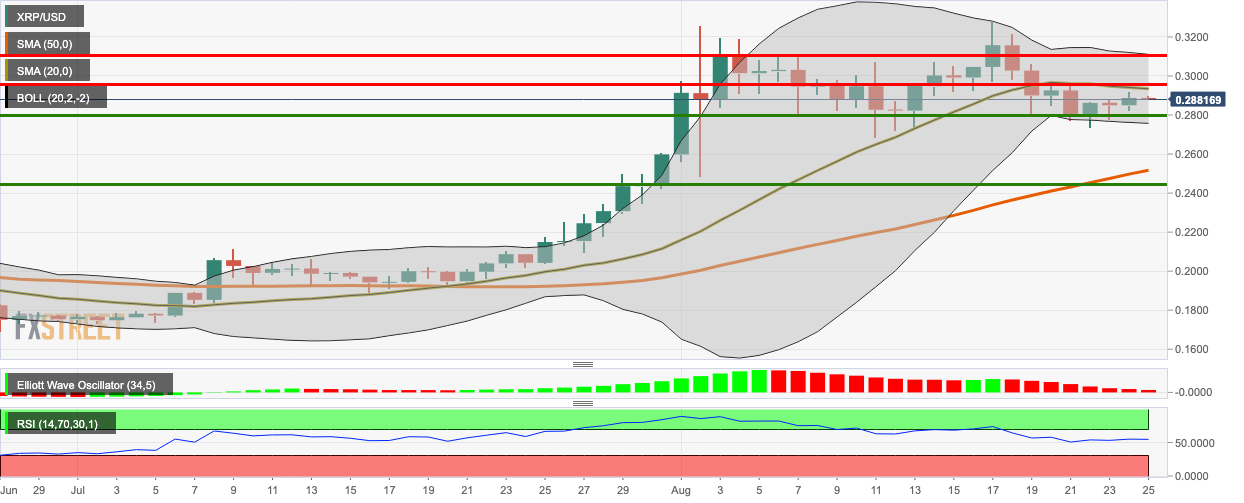
XRP/USD bears took charge in the early hours of Tuesday as the price fell from $0.2887 to $0.2880. The price is presently trending in the lower half of the 20-day Bollinger band, which has narrowed considerably to show decreasing price volatility. The Elliott Oscillator shows sustained bearish sentiment, while the relative strength index (RSI) is trending firmly in the neutral zone.
XRP/USD daily chart shows two strong resistance levels on the upside at $0.2954 (SMA 20) and $0.3103. On the other hand, the bears face three healthy support levels at $0.2795, $0.2520 (SMA 50) and $0.245.
Key levels
