- Ripple’s XRP sell-off is limited by $0.2800 at this stage.
- The next local barrier is created by the lower line of the 4-hour Bollinger Band.
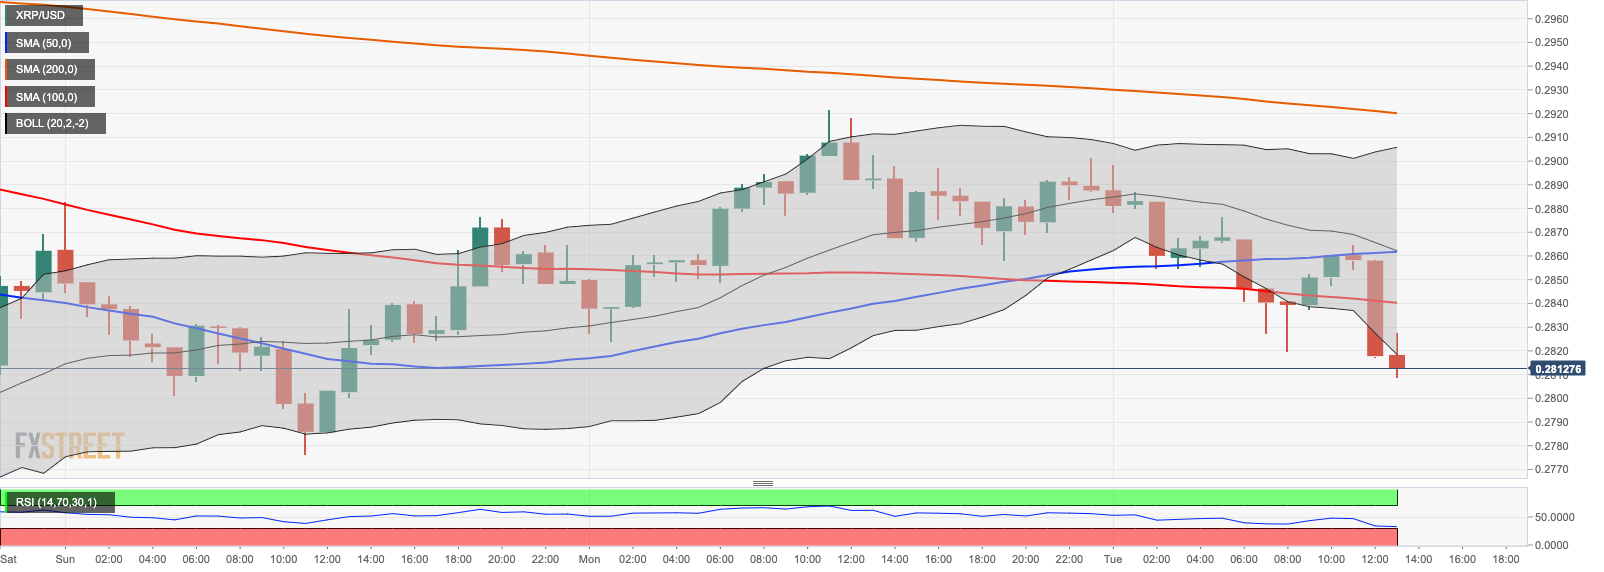
Ripple’s XRP tested the intraday low of $0.2800 amid major sell-off on the cryptocurrency market. At the time of writing, XRP/USD is changing hands at $0.2811, down 2.6% since the start of the day. On the intraday chart, the local resistance is created by 1-hour SMA100 on approach to $0.2840. Once it is out of the way, the upside is likely to gain traction with the next focus on a combination of 1-hour SMA50 and the middle line of the 1-hour Bollinger Band at $0.2860. This barrier stopped XRP’s recovery earlier during the day.
XRP/USD 1-hour chart
On the 4-hour time frame, XRP/USD moved in the lower part of the Bollinger Band with the next support at $0.2770. Coonsidering the downward-looking RSI, the coin may continue sliding down towards the said support, where fresh buyers are likely to join the market and trigger the upside correction.
XRP/USD 4-hour chart
-637339586064235074.png)
