- Bitcoin is currently trading at $10,374 after a slow recovery from the recent crash.
- Bulls are trying to push the price of BTC above a crucial resistance level.
Bitcoin did a good job defending a critical support level at $10,000. Even though prices slipped below this hurdle a few times, bulls quickly stepped in.
The behemoth digital currency is now changing hands at around $10,366, aiming for a prompt recovery.
BTC/USD 4-hour chart
-637353434493687328.png)
There are several patterns and indicators showing Bitcoin is poised for a significant move to the upside. The price action of the past few days formed a symmetrical triangle on the 4-hour chart which appears to have broken out with a decent move towards $10,414. Additionally, the Bollinger bands are notably squeezing, indicating that high volatility is nearby.
The upper band coincides with the 50-MA and a resistance level established on September 8 at $10,438. A move above the $10,400-10,500 area with a strong close above it will likely push Bitcoin up to $11,400. This resistance level was built after the first leg down from the recent crash on September 4.
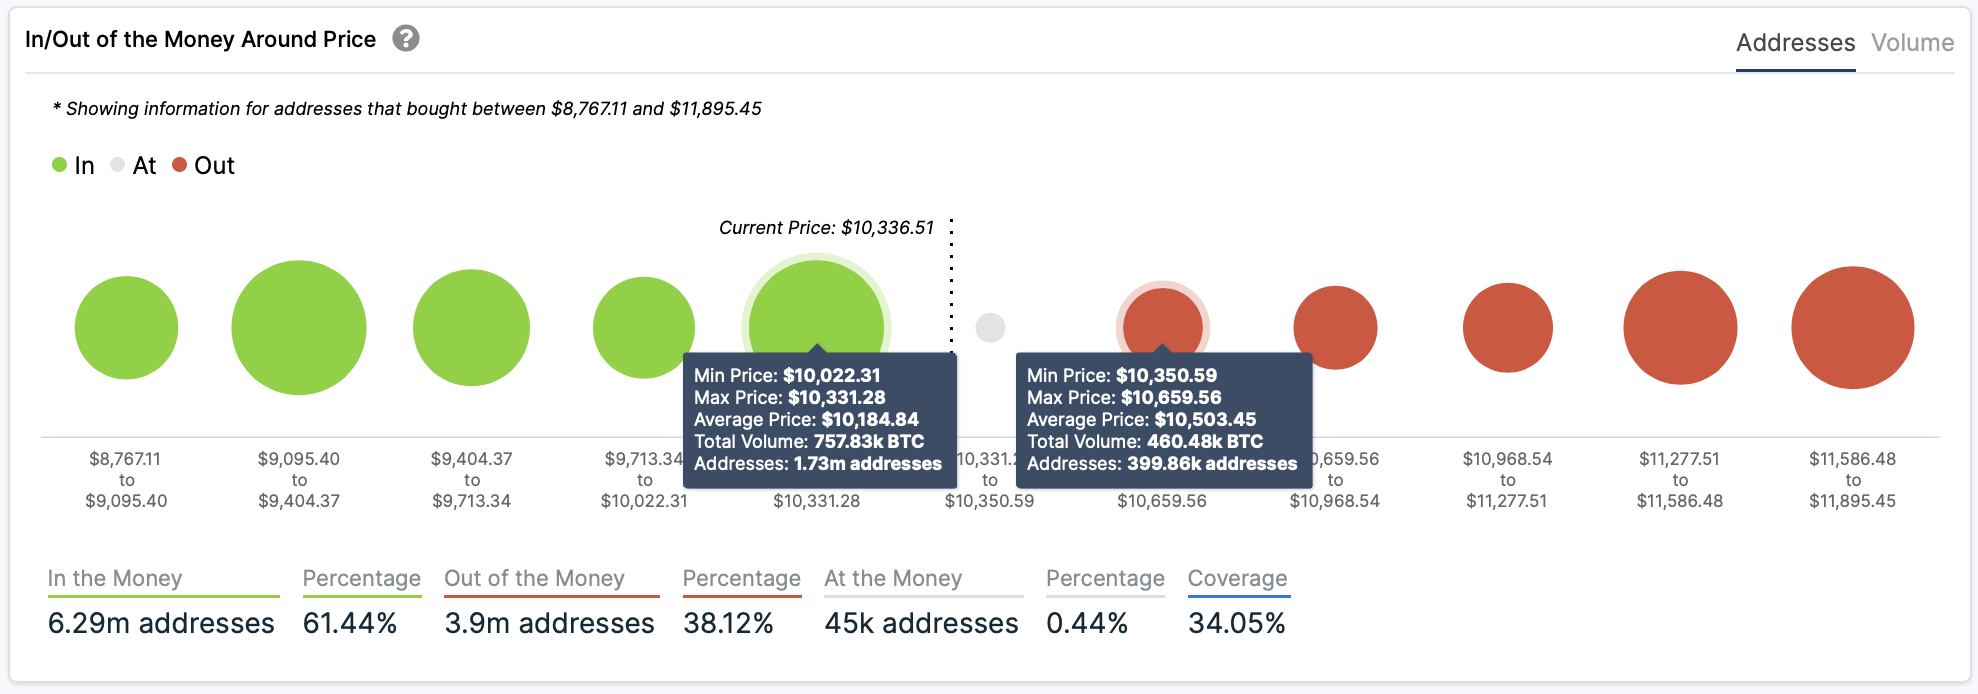
It is worth mentioning that the flagship cryptocurrency could also slide towards the lower Bollinger band and have a bearish breakout towards $9,100. However, IntoTheBlock’s IOMAP index shows that support is far stronger than resistance.
BTC/USD 1-hour chart
-637353434954677751.png)
The 1-hour chart adds credence to this thesis as Bitcoin is currently in a strong hourly uptrend climbing above the 50-MA and the 100-MA without overextending the RSI. Both MAs are also on the verge of a golden cross, something that hasn’t happened since August 30.
