- NEO price formed a double top on the daily chart, but overall sentiment remains bullish.
- NEO is currently trading at $22.058, as selling pressure doesn’t seem to be affecting the price just yet.
NEO established the 2020-high on August 30 at $22.9. Around two weeks later, the digital asset managed to touch $22.53 and pulled back, forming what is known as a double top, a bearish pattern.
NEO/USD daily chart
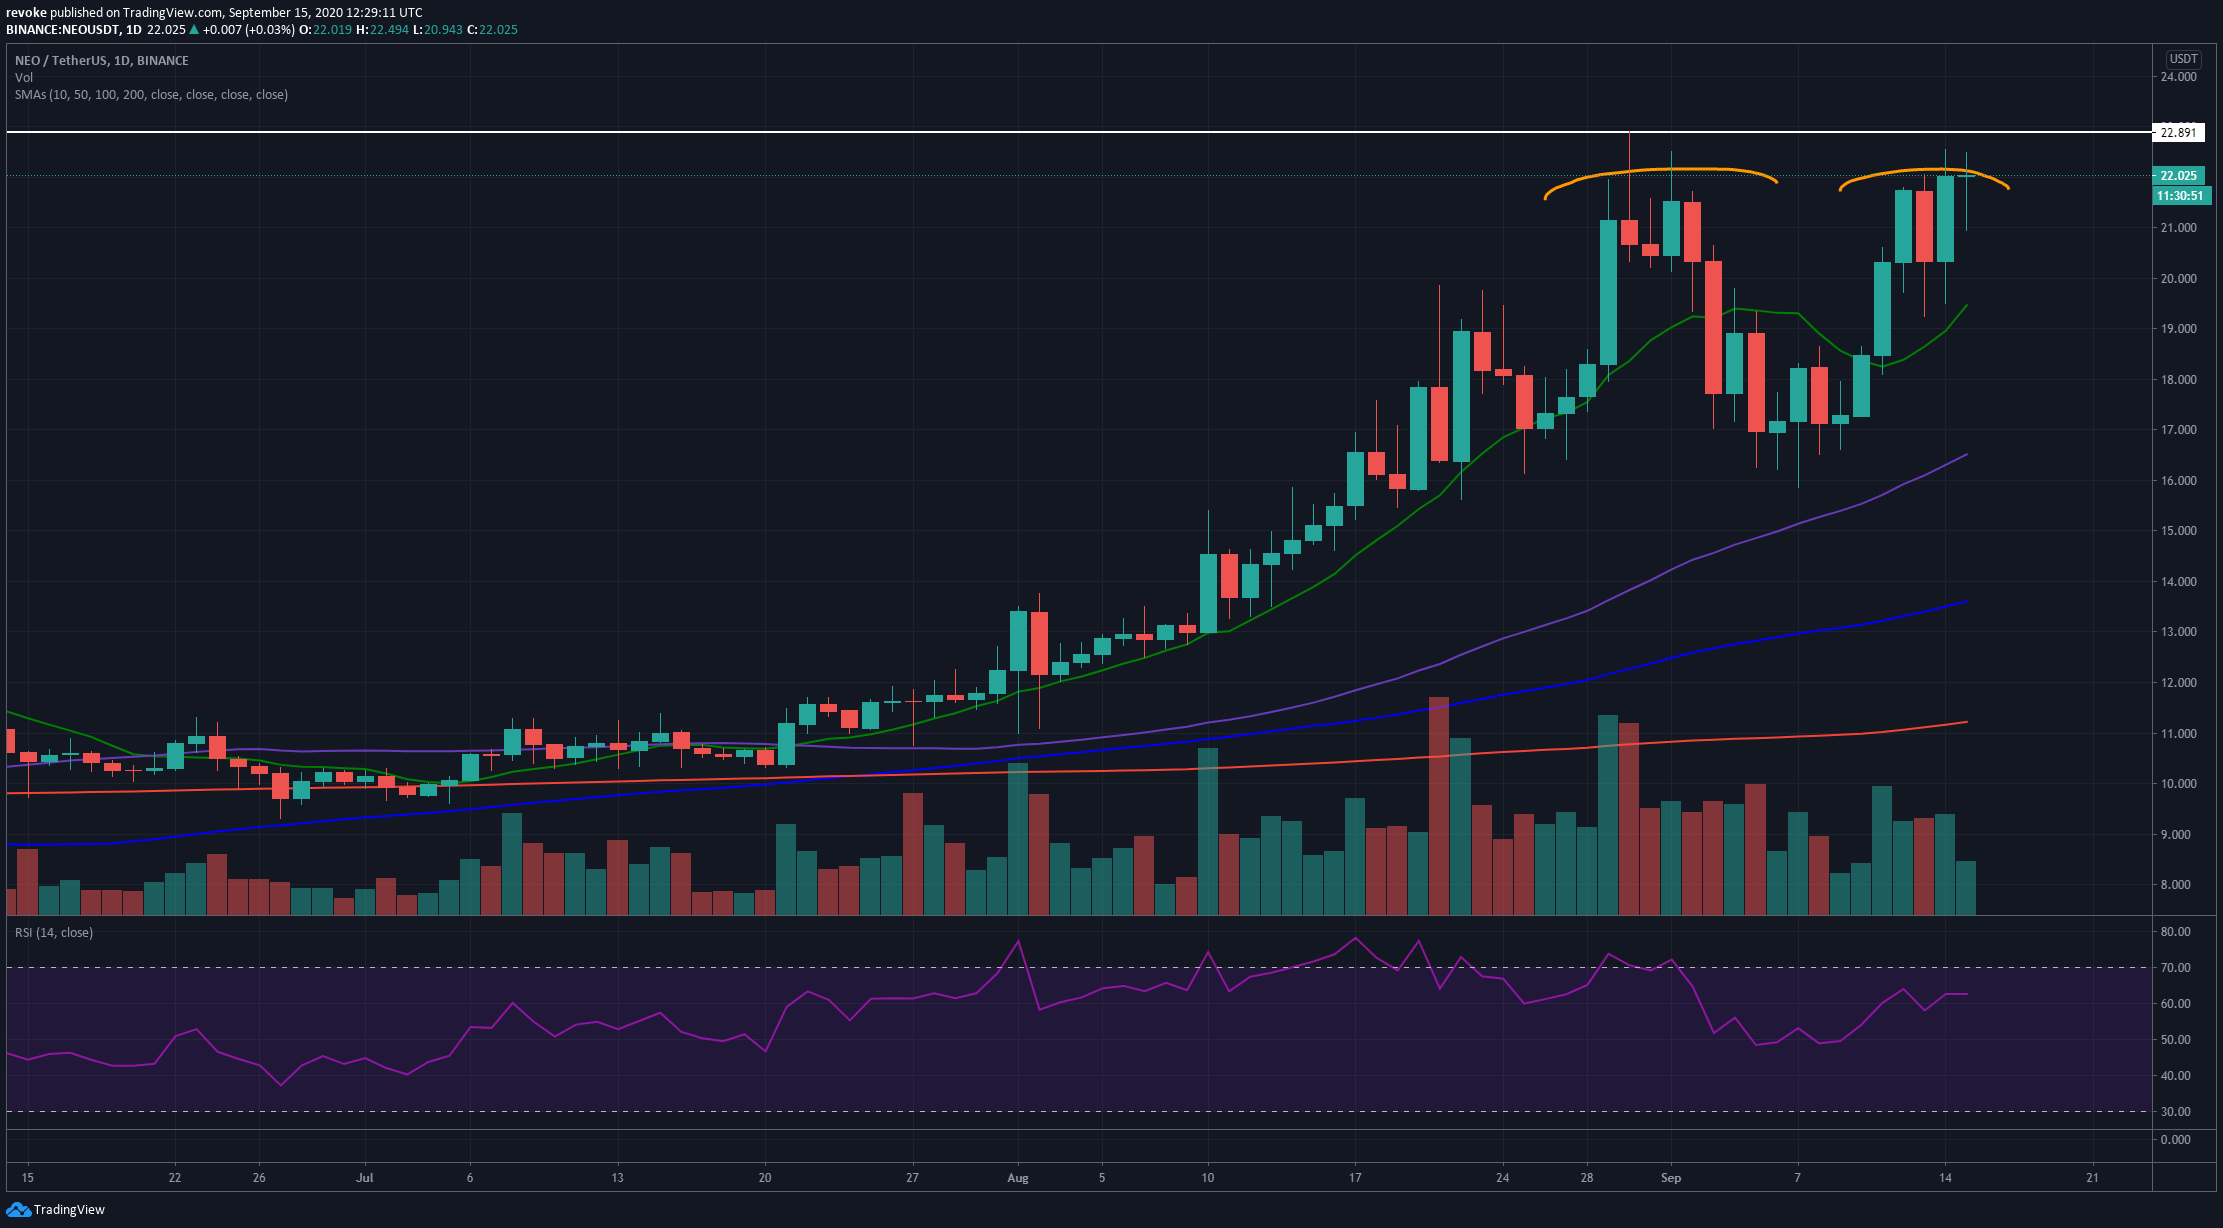
While NEO price did form a double top on the daily chart, bears didn’t really get any significant continuation moves. NEO did pullback towards $20.94 but quickly recovered, and it’s now trading at $22 again. The absolute resistance level is clearly set at $22.9. If the bulls can crack this level, they will invalidate the double top and continue with the daily uptrend.
On the other hand, if NEO price attempts to break $22.9 and fails, bears could get the upper hand, but they would need a notable continuation move down to $20 to confirm it. The RSI has been overextended for the entirety of August, and it’s now at 62.51, indicating that a correction might be needed.
NEO/USD 4-hour chart
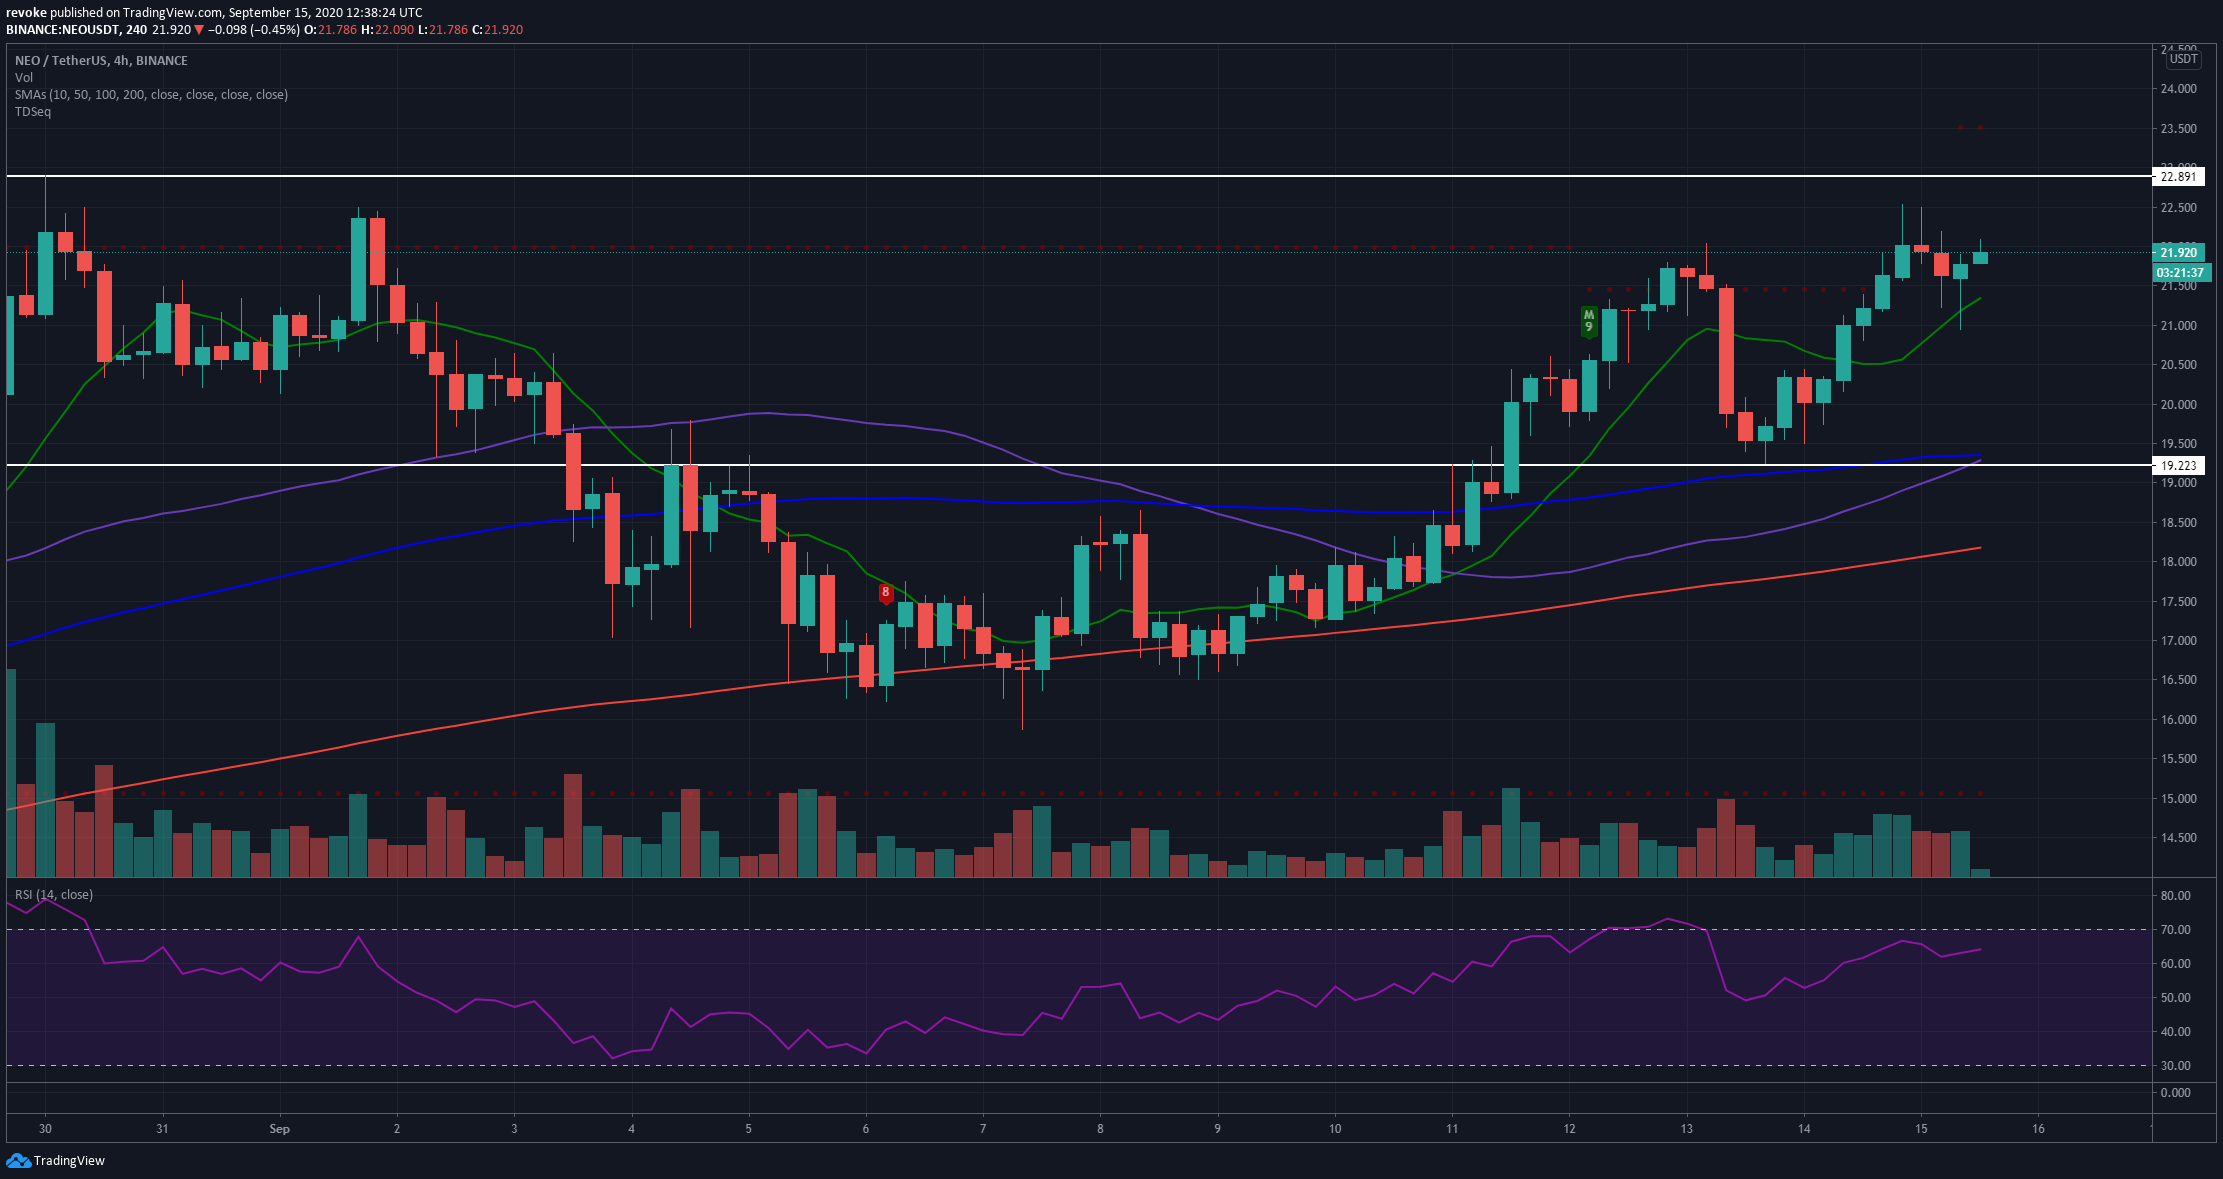
On the 4-hour chart, however, bulls are in full control, establishing a clear uptrend for NEO. The last low is down at $19.24, which means anything above this level should be considered a higher low and a possible continuation of the uptrend.
On the other hand, the TD sequential seems to be on the verge of creating a sell signal on the 4-hour chart, but this doesn’t mean the uptrend will be lost. It’s also important to note that the entire cryptocurrency market is quite bullish again, with Bitcoin nearing $11,000.
