- MKR is trading inside an ascending triangle pattern.
- Several on-chain metrics have turned bullish in favor of MKR, which is eying up $700.
MKR has been trading inside an ascending triangle for around 20 days, currently at $589, with a precise resistance level located at $604. The price got rejected several times from this upper boundary, but the support trendline below was held.
A breakout above $604 can drive MKR towards $700
On the 4-hour chart, MKR’s price got rejected several times from the upper boundary of the triangle. However, the price has climbed above the 50-SMA and the 100-SMA, turning both into support levels. Most notably, the MACD is on the verge of turning bullish.
MKR/USD 4-hour chart
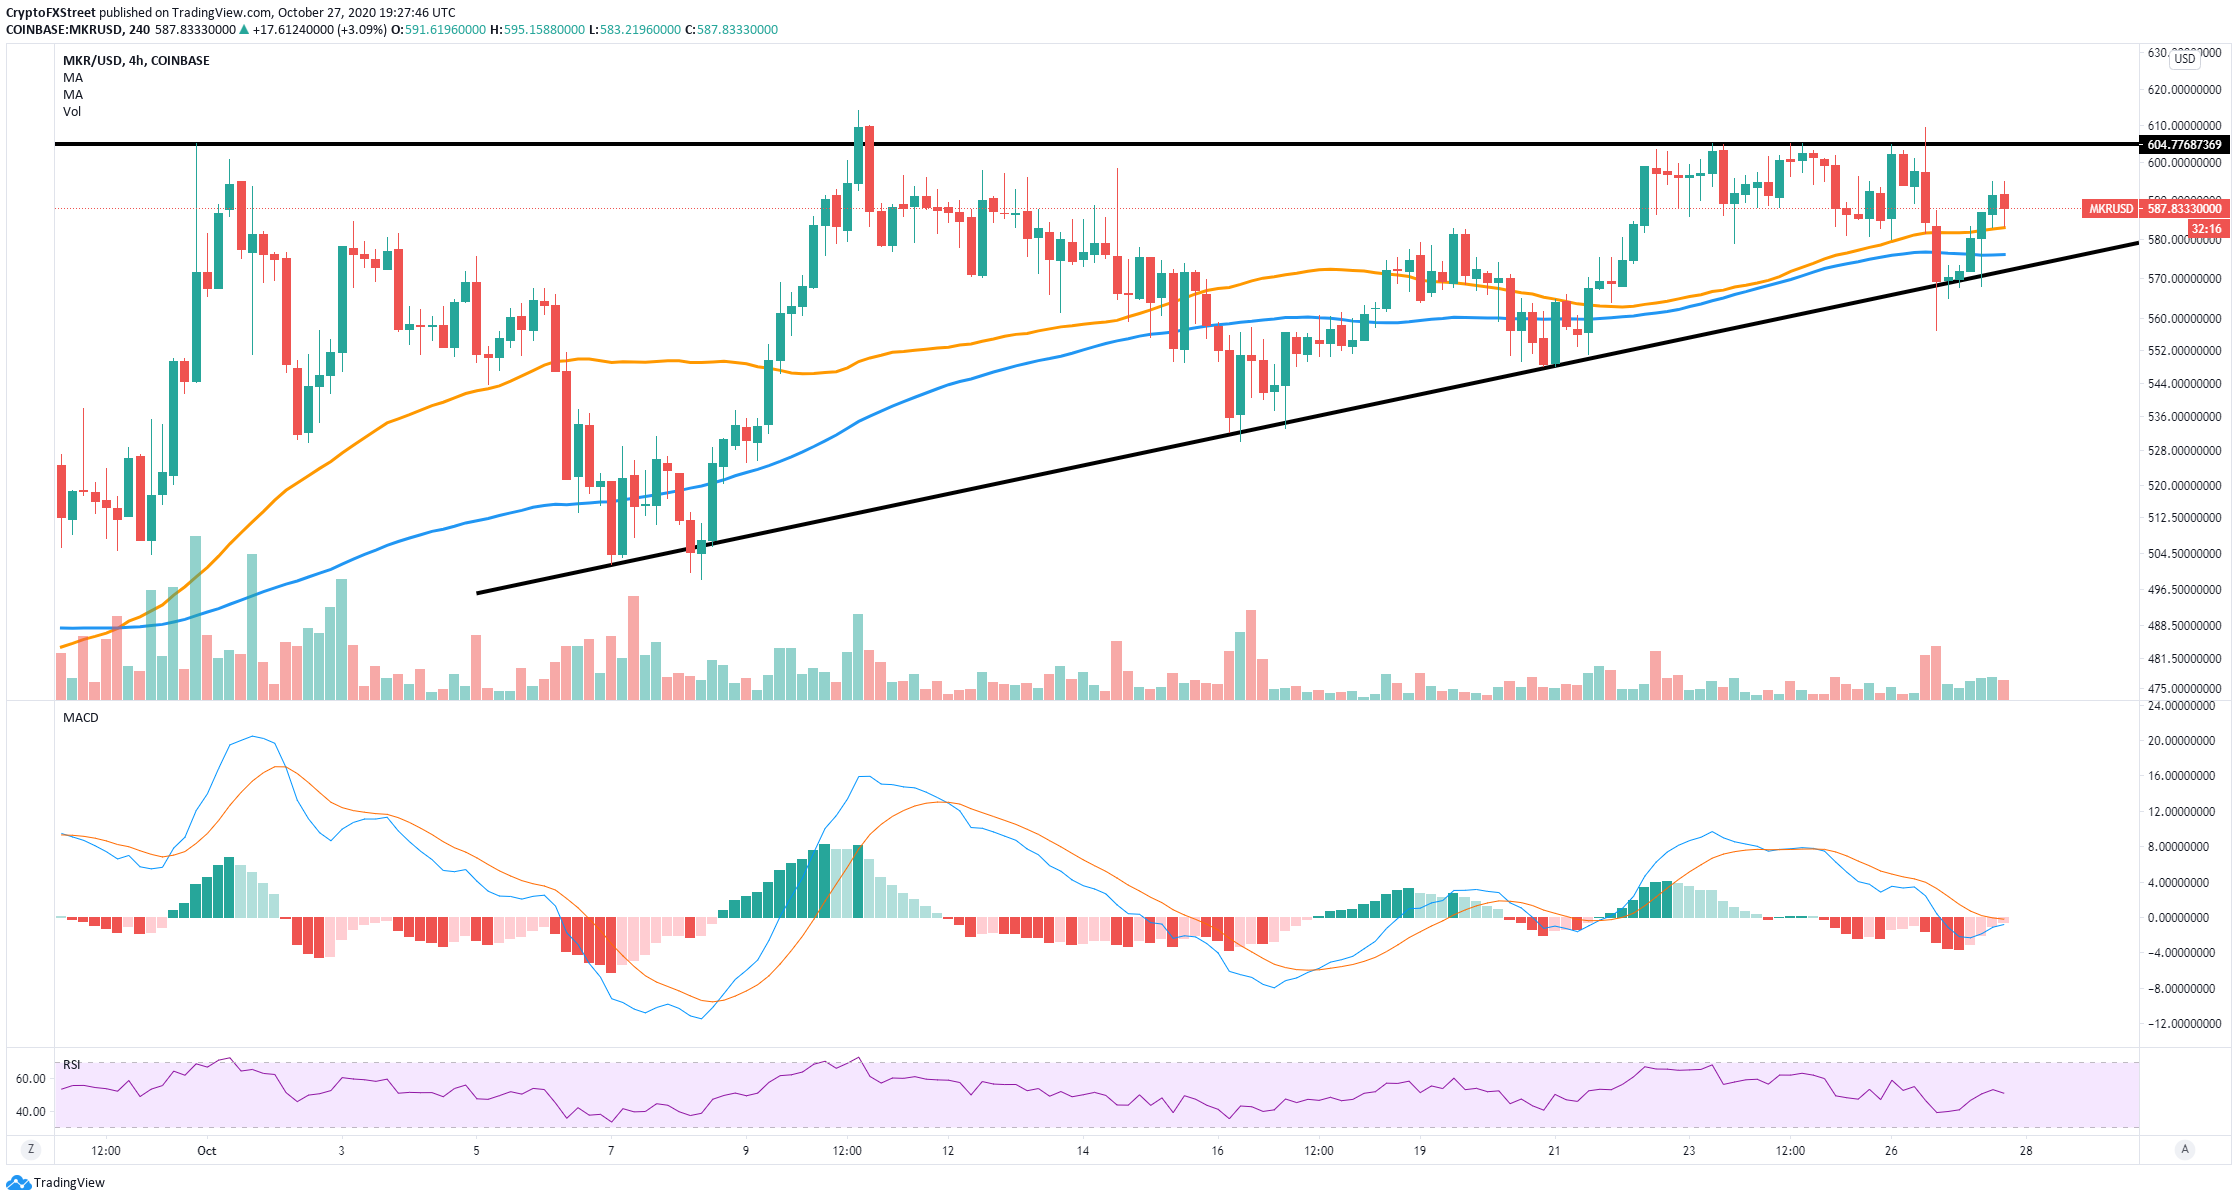
The last time this happened, the price of MKR rose by 6% within the next 24 hours. A bullish breakout above the resistance level at $604 can drive the digital asset towards a price target of $700.
MKR New Addresses chart
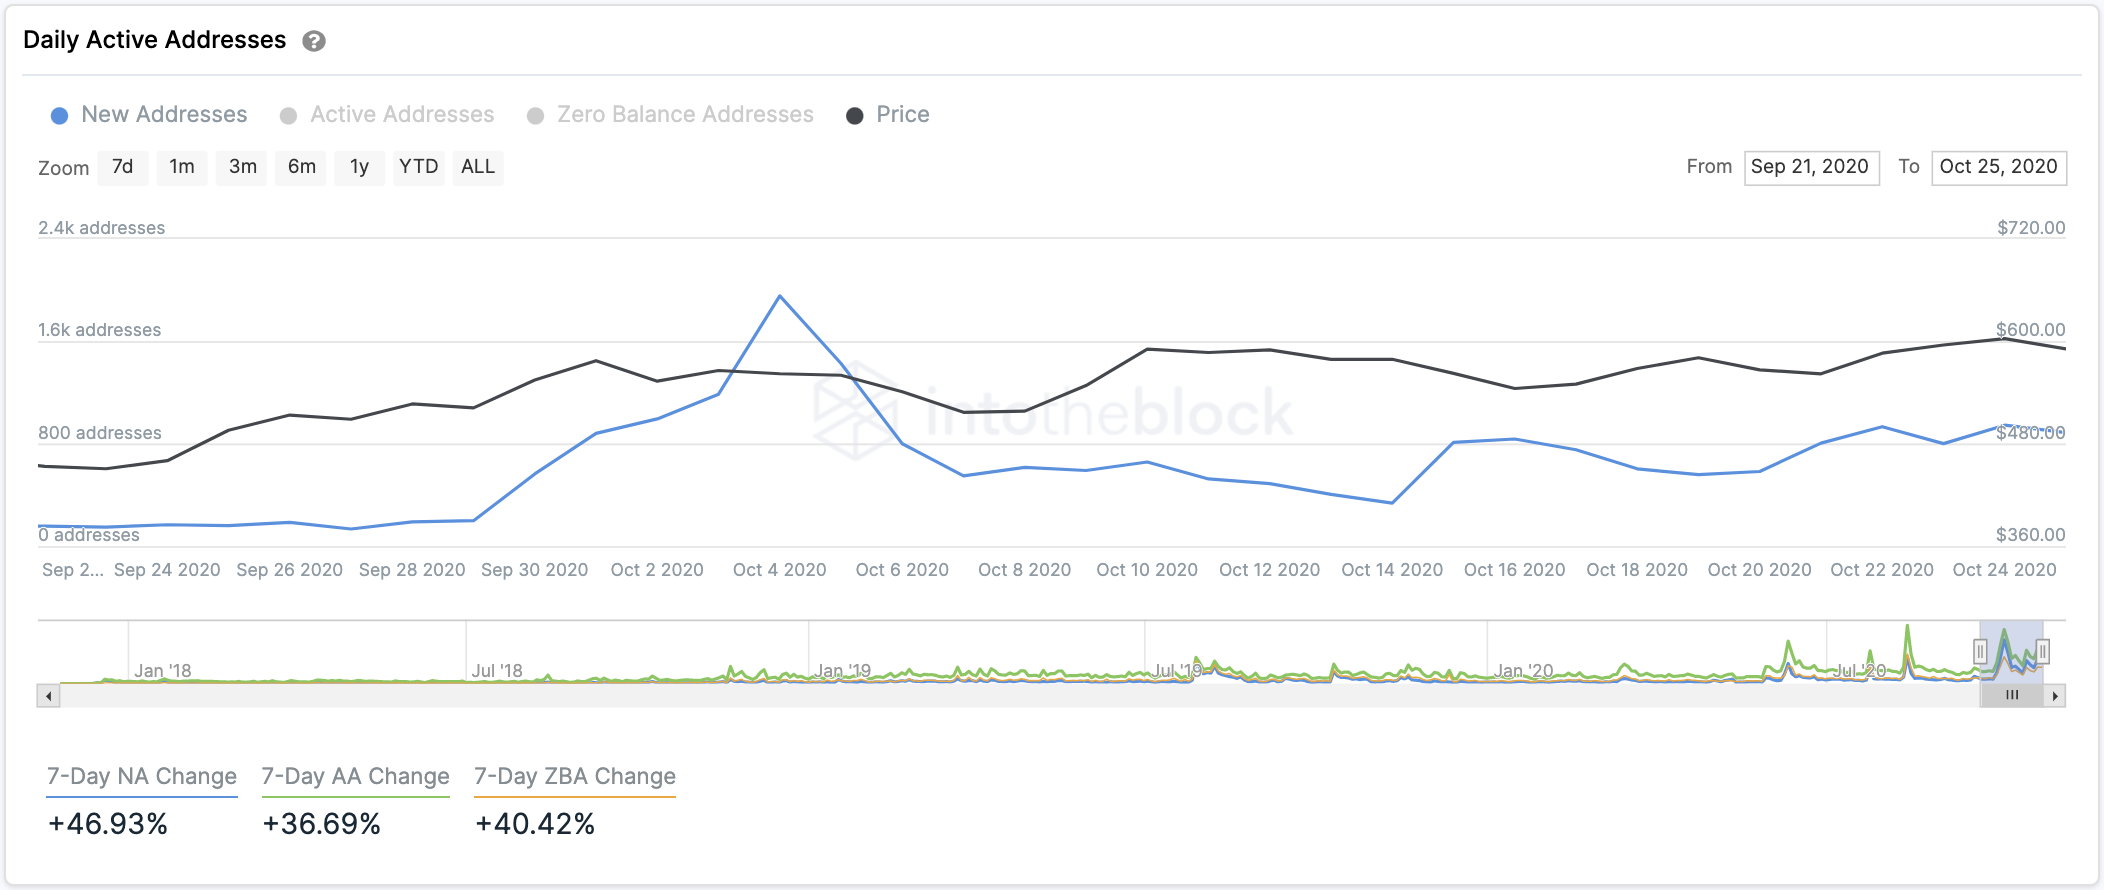
The number of new addresses joining the MakerDAO network is increasing significantly at 47% over the past week. This rise suggests that new investors are highly interested in the digital asset, which translates into buying pressure.
MKR MVRV chart
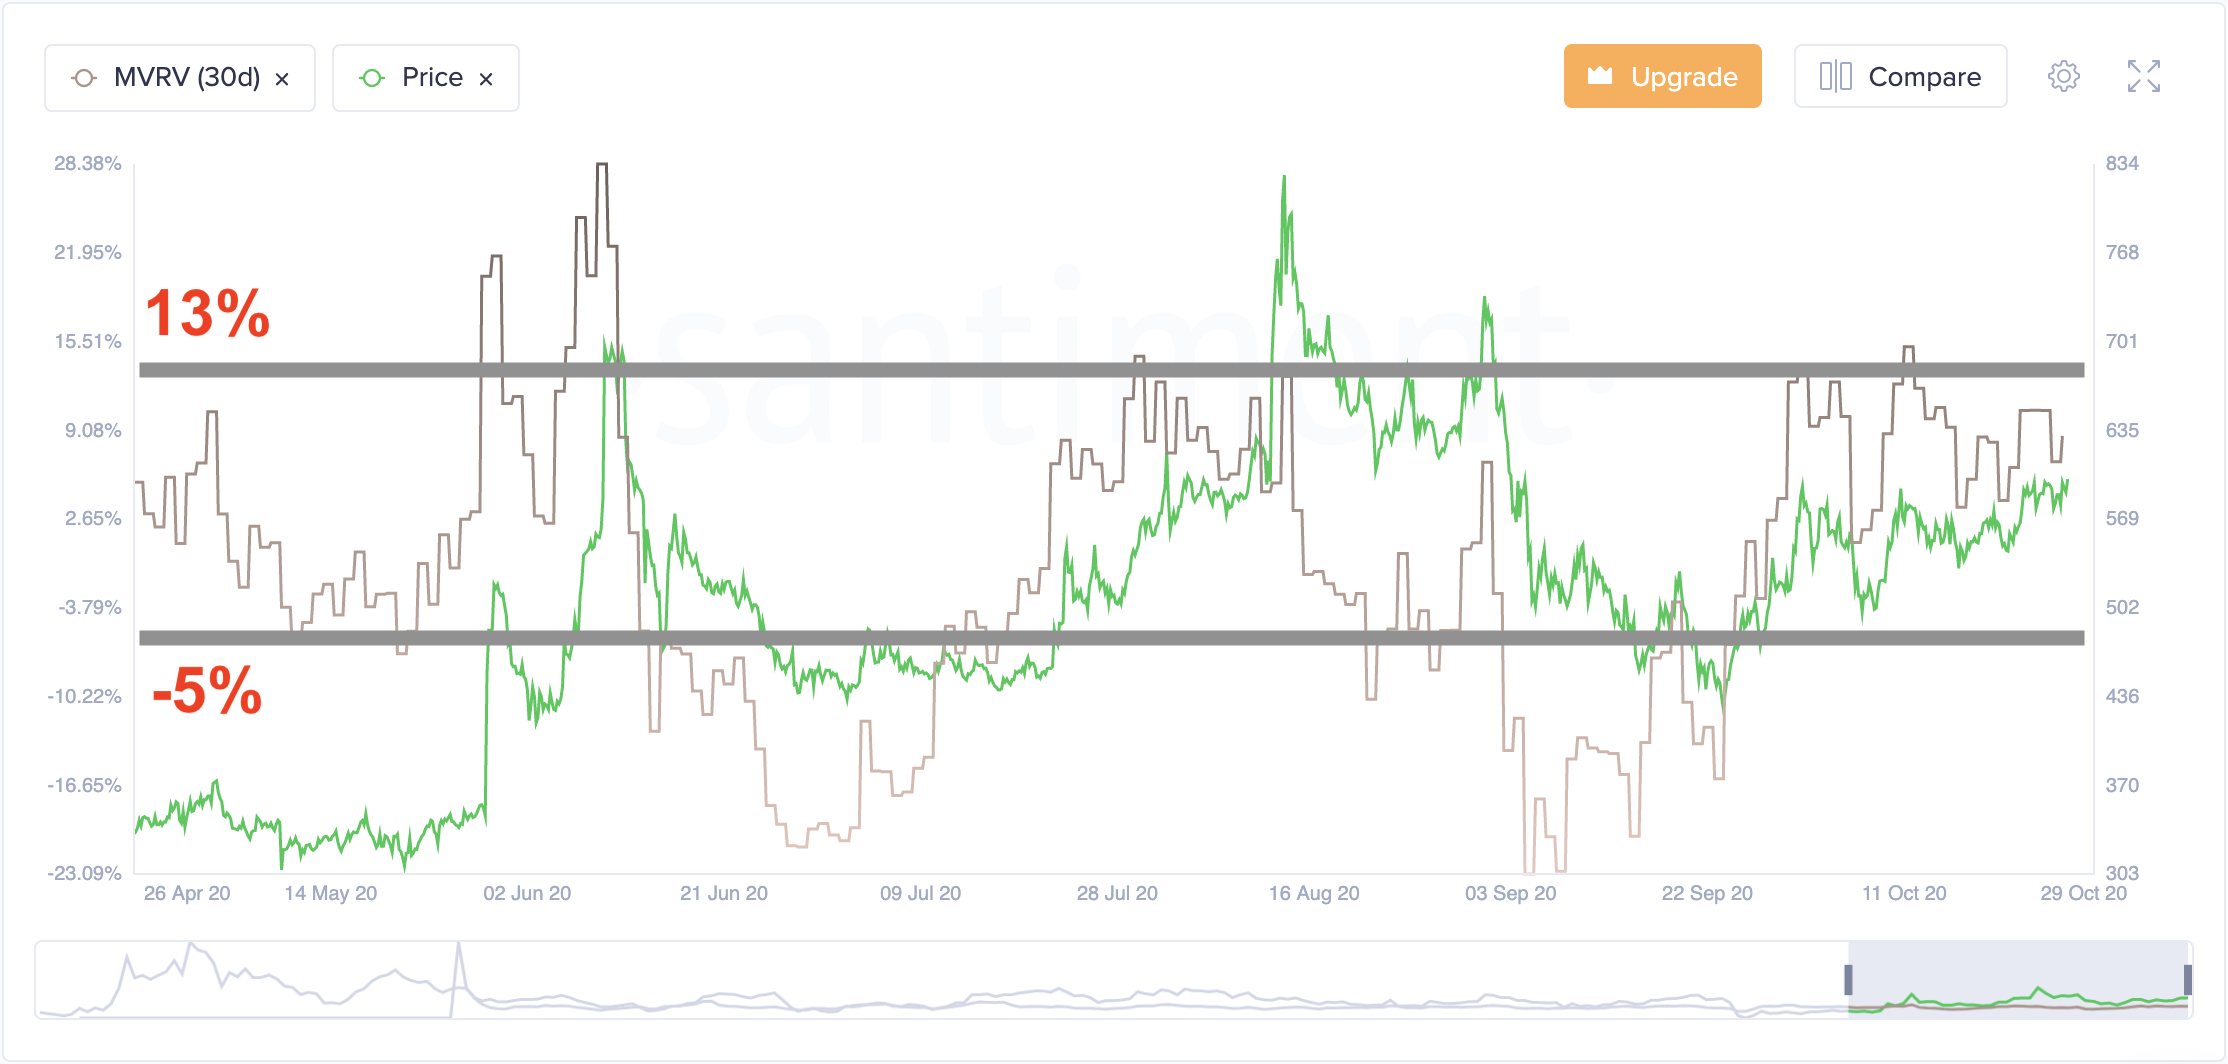
The Market-Value-to-Realized-Value (MVRV) ratio shows that bulls have a lot of room upside until it hits the ‘danger zone,’ which is above 13%. This area is currently located at around $700, which is the bullish price target for MKR.
Bears can push MKR down to $500
Nonetheless, failure to hold the 50-SMA and the 100-SMA on the 4-hour chart would shift the odds in favor of the bears. Breaking below the lower boundary of the ascending channel, presently around $575, can drive MKR down to $500.
MKR IOMAP Chart
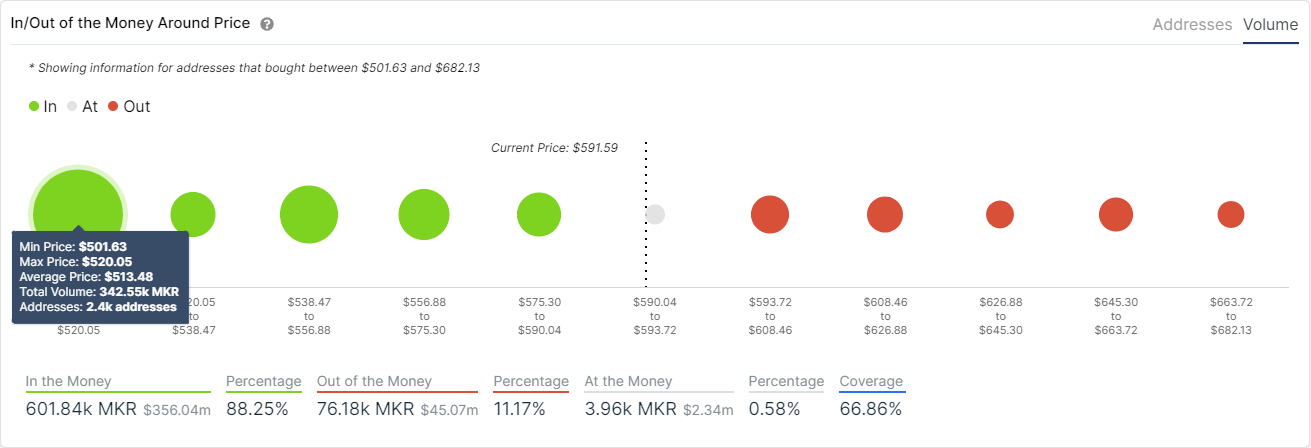
This theory is further confirmed by the In/Out of the Money Around Price chart, which shows very little support until the area between $501 and $520 with a total volume of 342,000 MKR tokens. Inside this range of prices, a lot of investors bought a large sum of MKR tokens.
