- Bitcoin Cash has three healthy support walls on the downside.
- The number of addresses holding 10,000-100,000 tokens has dipped over the last few days.
Bitcoin Cash bulls managed to bounce from the 50-day SMA and take the price up from $241.30 on November 4 to $270.35 on November 8. Since then, the price has dipped to $266.60, at the time of writing. Technical analysis shows that the Bitcoin fork is going to drop even more.
Bitcoin Cash faces immediate resistance
The daily confluence detector is a handy little tool that helps us visualize strong resistance and support levels. According to the tool, BCH faces strong resistance at $267. This barrier looks strong enough to absorb an immense amount of buying pressure.
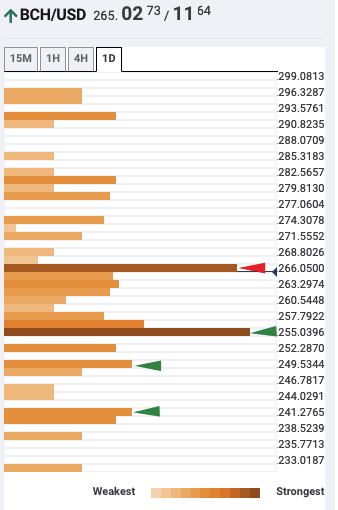
BCH daily confluence detector
The three healthy support walls in the confluence detector coincide with the 100-day SMA ($255.50), 200-day SMA ($249) and 50-day SMA ($245) in the daily chart. These walls seem strong enough to absorb a tremendous amount of selling pressure. As such, we can effectively cap off the downside at the 50-day SMA.
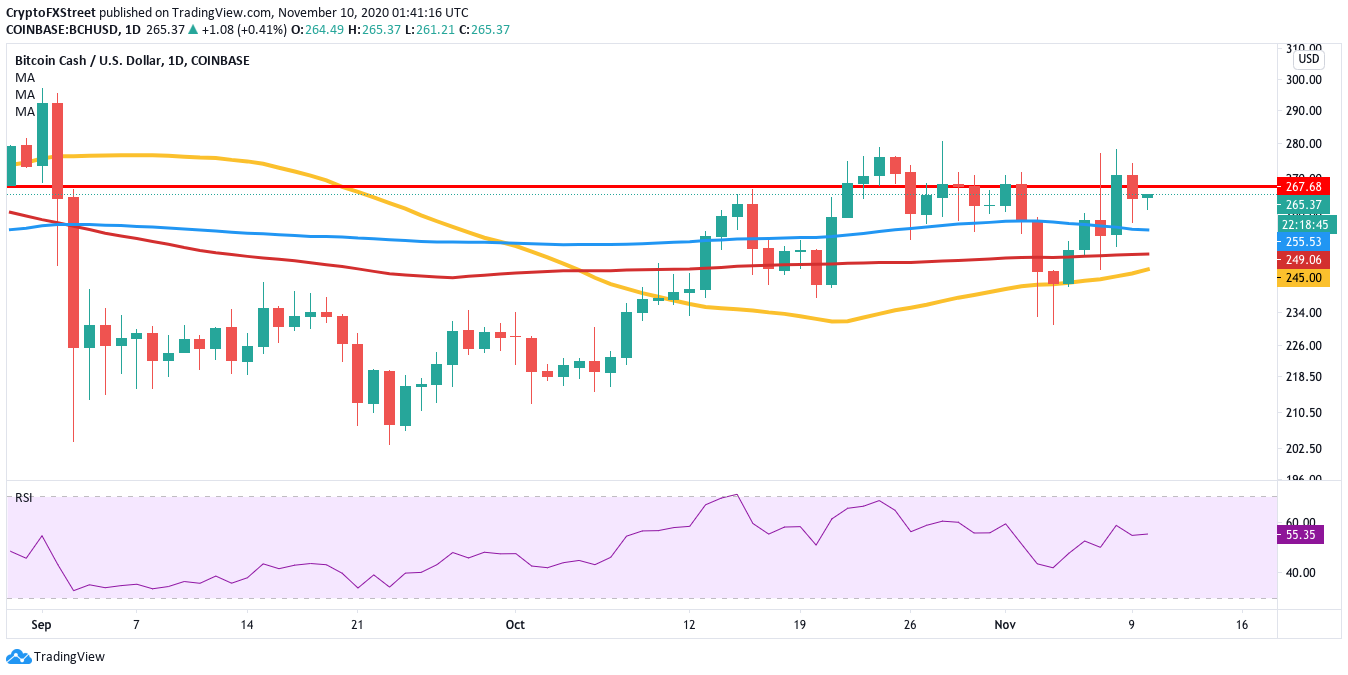
BCH/USD daily chart
Adding further credence to our bearish credence is Santiment’s holders distribution chart. As per the chart, the number of addresses holding 10,000 – 100,000 tokens dipped from 177 on November 7 to 171 at the time of writing. This shows that the whales have been selling off their holdings, which is a very negative sign for BCH.
%20%5B07.03.37,%2010%20Nov,%202020%5D-637405735191363623.png)
BCH holders distribution
While the market’s overall outlook looks pretty bearish, the buyers can still flip the script around. If they somehow manage to flip the $267 resistance into support, they will have the license to take the price up to $300. However, this optimistic outlook seems unlikely for now.
