- The community celebrated Yearn .finance’s newly launched vault as the price shot toward $20,000.
- YFI bullish momentum hit pause slightly above $19,000, forcing bulls to confirm support at $17,800.
Yearn.finance bled profusely from its all-time high of $44,000. The hunt for support took longer than expected, with YFI spiraling under $10,000. However, a bottom was recently discovered at $8,000, breathing fresh air into the market.
Yearn.finance launches yveCRV vault
A massive rally over the last 48 hours culminated in massive gains, where Yearn.finance hit levels above $19,000. The rally has been attributed to the launch of a new liquidity vault referred to as yveCRV vault. Users within the community received the news positively as the new vault earned higher fees than the base version, veCRV.
This yearn “backscratcher” vault is really cool. A more positive sum approach vs farms being parasitic to one another. At this rate it would take just >2 yrs (note: apy varies) to make income back from crv deposited but if you use other yearn products it’ll benefit them as well. https://t.co/kEWL48GqPd
“” Ceteris Paribus (@ceterispar1bus) November 8, 2020
Simultaneously, a new Zap has also been integrated into the user interface to connect the vault to the base version. In other words, yveCRV “accepts CRV in exchange for a perpetual claim on Curve DAO admin fees across all yearn products.” Users must know that the vault locks the tokens for over four years and does not come with withdrawal functionality.
Yearn.finance massive recovery hits pause
YFI broke out of a descending wedge pattern discussed last week. The move gave the decentralized finance token a remarkable push above the 50-day SMA. YFI/USD extended the bullish leg towards $20,000 but hit a wall at $19,400. At the time of writing, the crypto is changing hands at $18,500 after a minor correction.
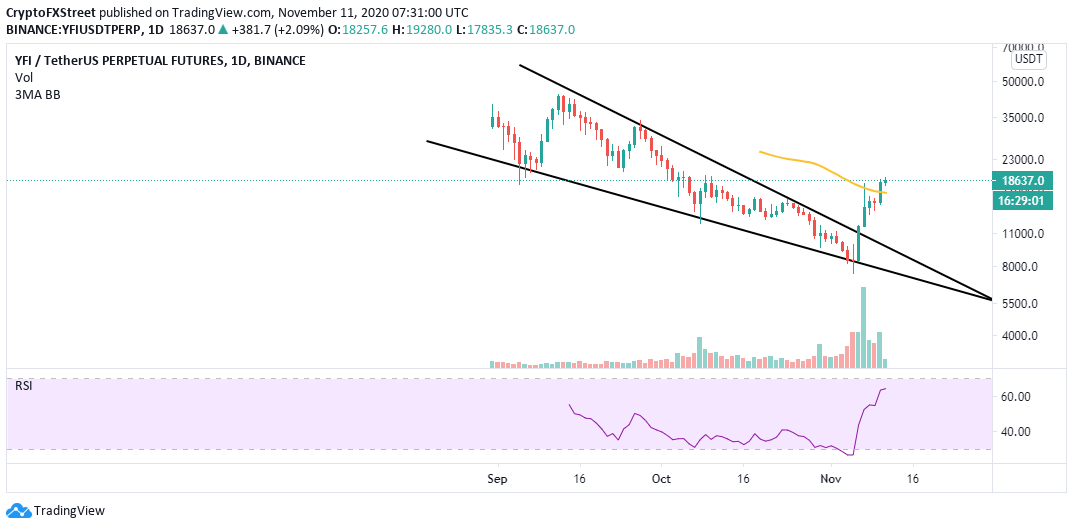
YFI/USD daily chart
The TD Sequential indicator recently presented sell signals on both the 1-hour and 4-hour charts in the form of green nine candlesticks. In other words, selling pressure could increase the headwind, hence a reversal to the 200 Simple Moving Average at $14,000. Extended losses may seek refuge at $12,000 aided by the 50 SMA and the 100 SMA.
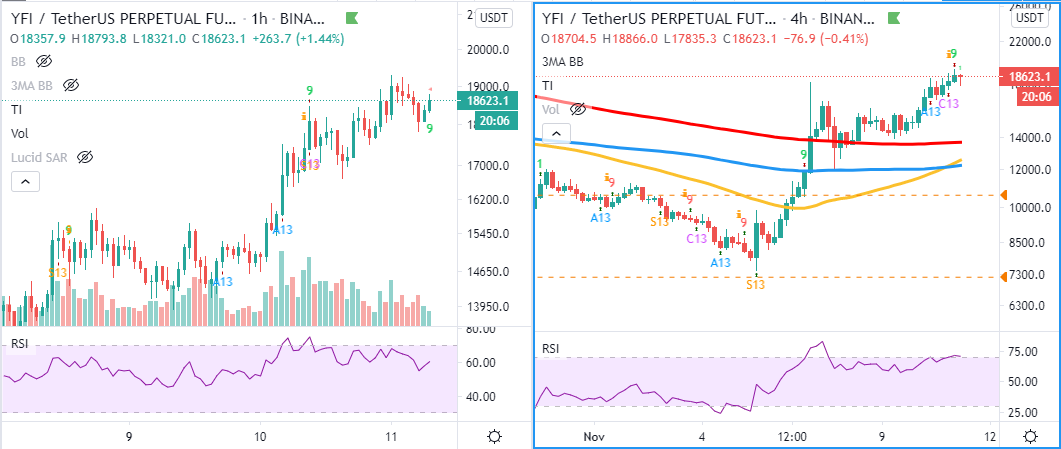
YFI/USD 1-hour and 4-hour charts
IntoTheBlock’s IOMAP chart suggests that the path of least resistance is upwards, thereby invalidating the bearish outlook. A subtle resistance zone has been illustrated by between$18,745 and $19,299. Here, 185 addresses had previously bought roughly 738 YFI. Price action above this zone might see the token lift to $20,000.
-637406786107233956.png)
YFI IOMAP model
On the downside, immense support was provided by 625 addresses that had previously purchase 3,200 YFI in the range between $18,150 and $18,703. Although it is doubtful that losses will exceed this zone, a break under this buyer congestion may trigger a minor retreat to $17,000.
