- Uniswap stalls after a massive 80% upswing in November.
- The pressure upon the decentralized finance token is starting to build under $3.28 (month-long hurdle).
Uniswap has soared from the lows posted in November around $1.75 to the prevailing market value of $3.15, representing a growth of nearly 80%. The token assumed a gradual price action to the upside within an ascending parallel channel. Buyers had their eyes on $4, but UNI encountered a month-long resistance at $3.28. The bullish momentum seems to have lost traction, with UNI retreating towards the channel’s middle boundary.
Uniswap reversal could wipe off November gains
A building bearish momentum shows that the path of least resistance is downwards. As mentioned, the upside is barricaded by the upper boundary of the ascending channel in addition to the hurdle highlighted at $3.28. The Relative Strength Index adds weight to the incoming bearish outlook, following the rejection at 70 (overbought region).
Sellers will assume significant control over the token if the price fails to hold above the channel’s middle boundary. Extended losses may come into the picture in case of a breakdown under the 200 SMA and the channel’s lower limit. The 50 SMA in the 4-hour timeframe might absorb the selling pressure. Other key support areas to keep in mind are the 100 SMA, the demand at $2.4, and the buyer congestion at $1.75.
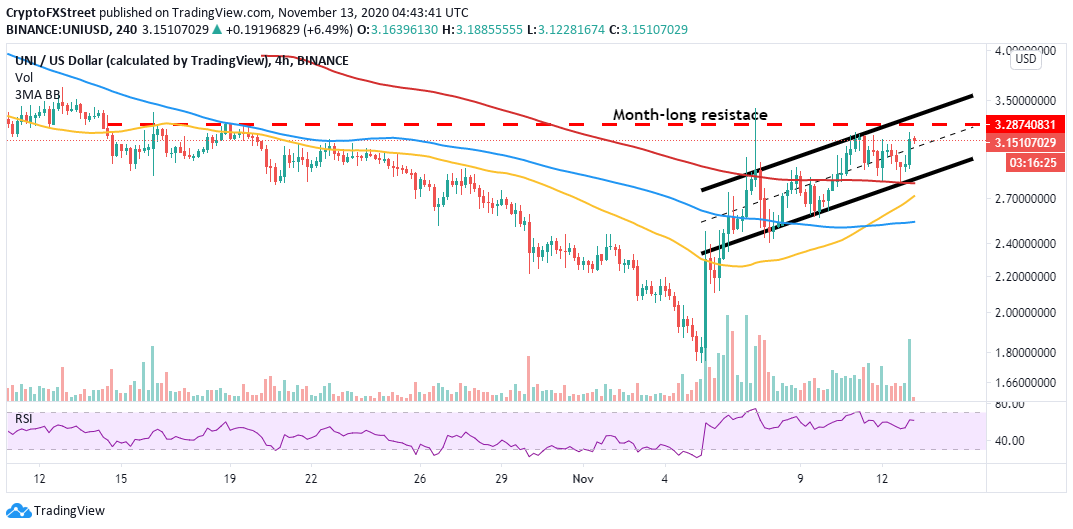
UNU/USD 4-hour chart
The TD Sequential indicator could present a sell signal on the daily chart in a few hours. The sell signal is expected to take the form of a green nine candlestick and add credibility to the bearish outlook. The 50-day SMA limits the immediate upside, hence the unlikelihood of Uniswap spiking to $3.5 in the near term.
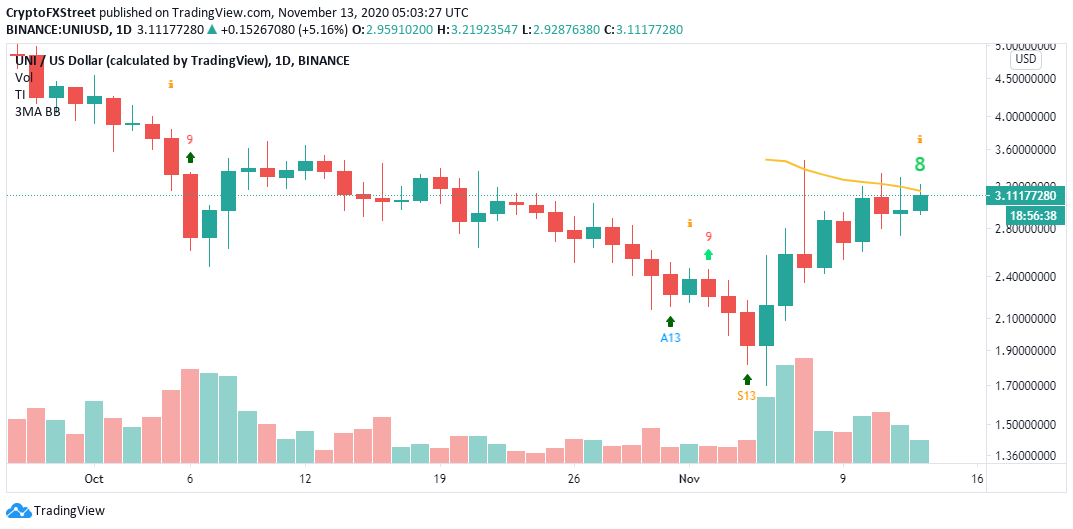
UNI/USD daily chart
The IOMAP by IntoTheBlock gives credence to the resistance anticipated ahead of Uniswap. This on-chain metric places the first critical hurdle between $3.2 and $3.3. Here, 1,800 addresses previously purchased roughly 15 million UNI. Traders should be aware that if UNI slices through this zone, it could spike to $3.5.
-637408414785791602.png)
UNI/USD IOMAP model
On the downside, the model reveals growing support under UNI, with the most robust running from $2.9 to $3. Here, about 3,000 addresses previously bought approximately 22.9 million UNI. Therefore, this means that consolidation is likely to take precedence before UNI makes a significant price action either up or down.
