- YFI price had a massive 160% pump in the past week but it’s slowing down.
- Several metrics indicate that YFI is on the verge of a pullback.
After such a massive run, it’s not a surprise to see YFI price finally slow down and consolidate. On-chain and technical indicators suggest the digital asset is on the verge of a major correction as there is very little support on the way down.
YFI price is overextended and faces a pullback
On the daily chart, the TD Sequential indicator is about to present a sell signal which would be the first one since September 2. That last call had a 44% follow-through. A similar drop will drive YFI price towards $10,000.
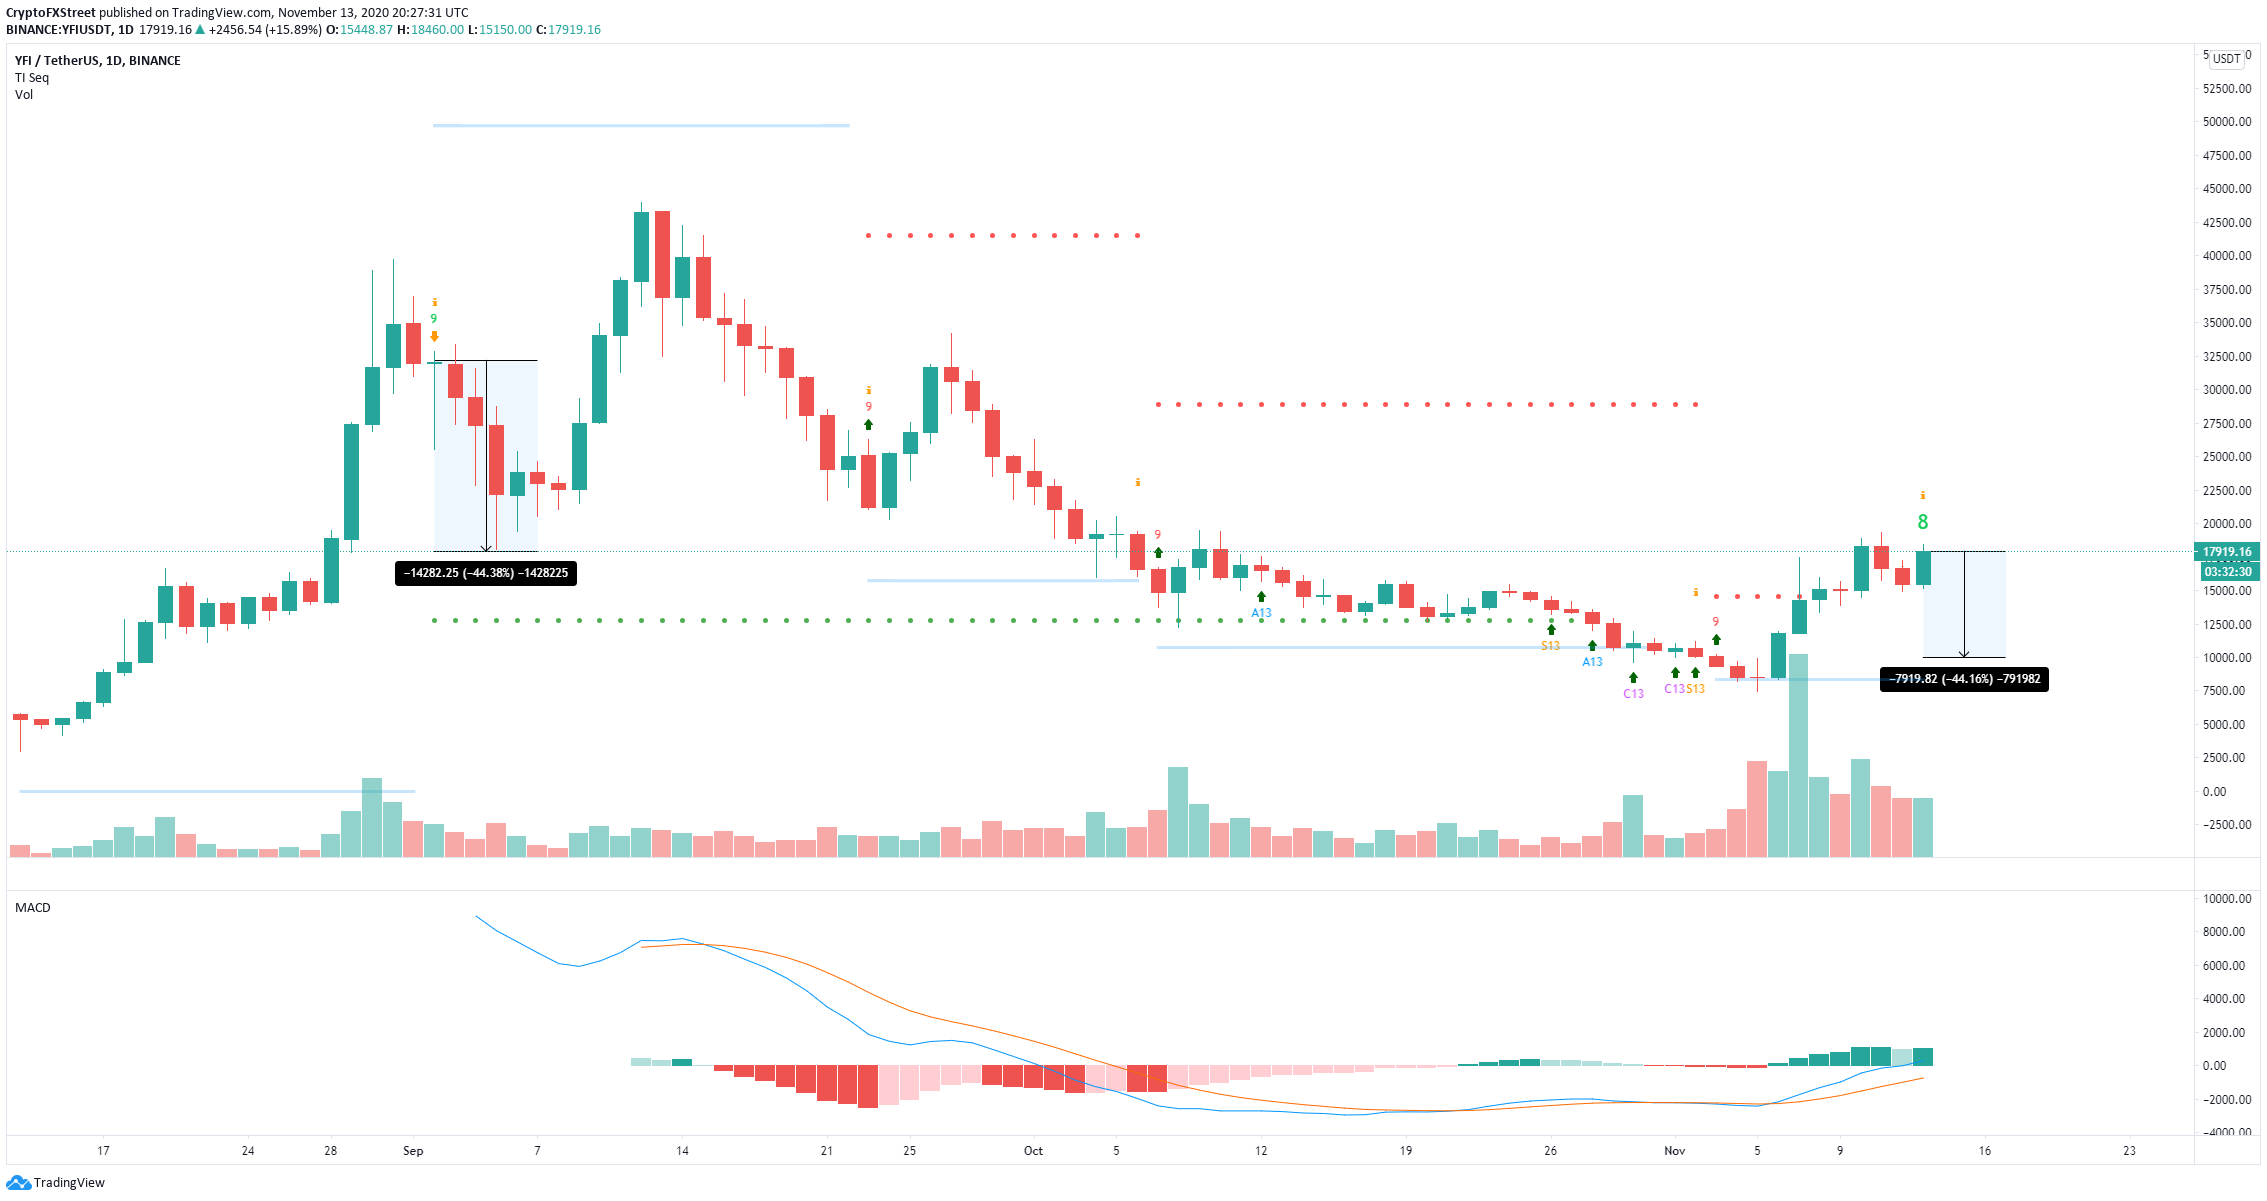
YFI/USD daily chart
Despite the spike in the number of new addresses joining the network on November 7, it seems that the trend is a downtrend now. In the past week, this number dropped by 14%. Similarly, the number of active addresses also dropped by 19%, indicating that investors are losing interest in YFI, despite its price growth.
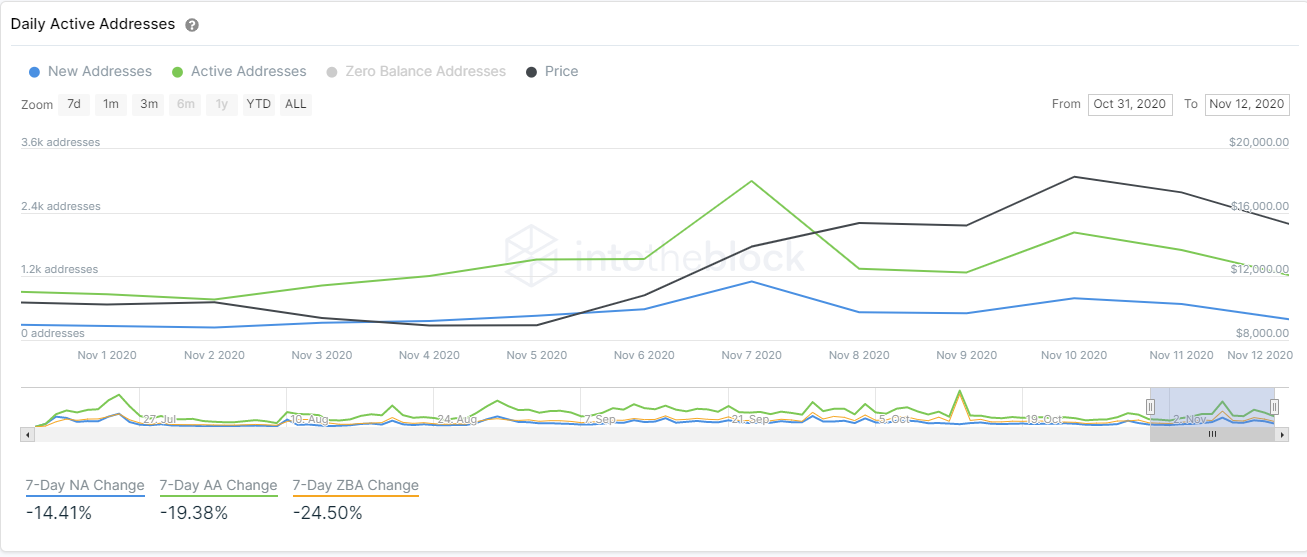
YFI new and active addresses chart
However, if bulls can drive YFI price through the resistance barrier at $18,000, we could see the digital asset jump towards $20,000 in the short-term. The MACD remains quite strong on the daily chart which indicates that bulls might still have some strength left.
