- Cardano stopped short of 4-hour 200 EMA and resumed the recovery.
- Further upside is limited by a massive resistance located on the approach to $0.13.
Cardano (ADA) has climbed to the 8th position in the global cryptocurrency market rating. The coin hit $0.194, the highest level since July 2020, on November 24, before the correction started. During early Asian hours on Thursday, ADA/USD retested a low of $0.112 and recovered to $0.137 by the time of writing. The coin has lost over 16% in the recent 24 hours; however, it is still 32% higher on a week-to-week basis.
Cardano’s current market capitalization is registered at $4.2 billion, while its average daily trading volumes settled at $2.3 billion.
Cardano bulls are waiting for the chance to get back to the market
From the technical point of view, ADA/USD may be ready for a sustainable recovery after the massive correction that happened overnight. On November 20, Cardano price broke the upper line of the ascending triangle on the 4-hour chart. The development translated into a massive bullish movement that took the coin to a new multi-year high above $0.19.
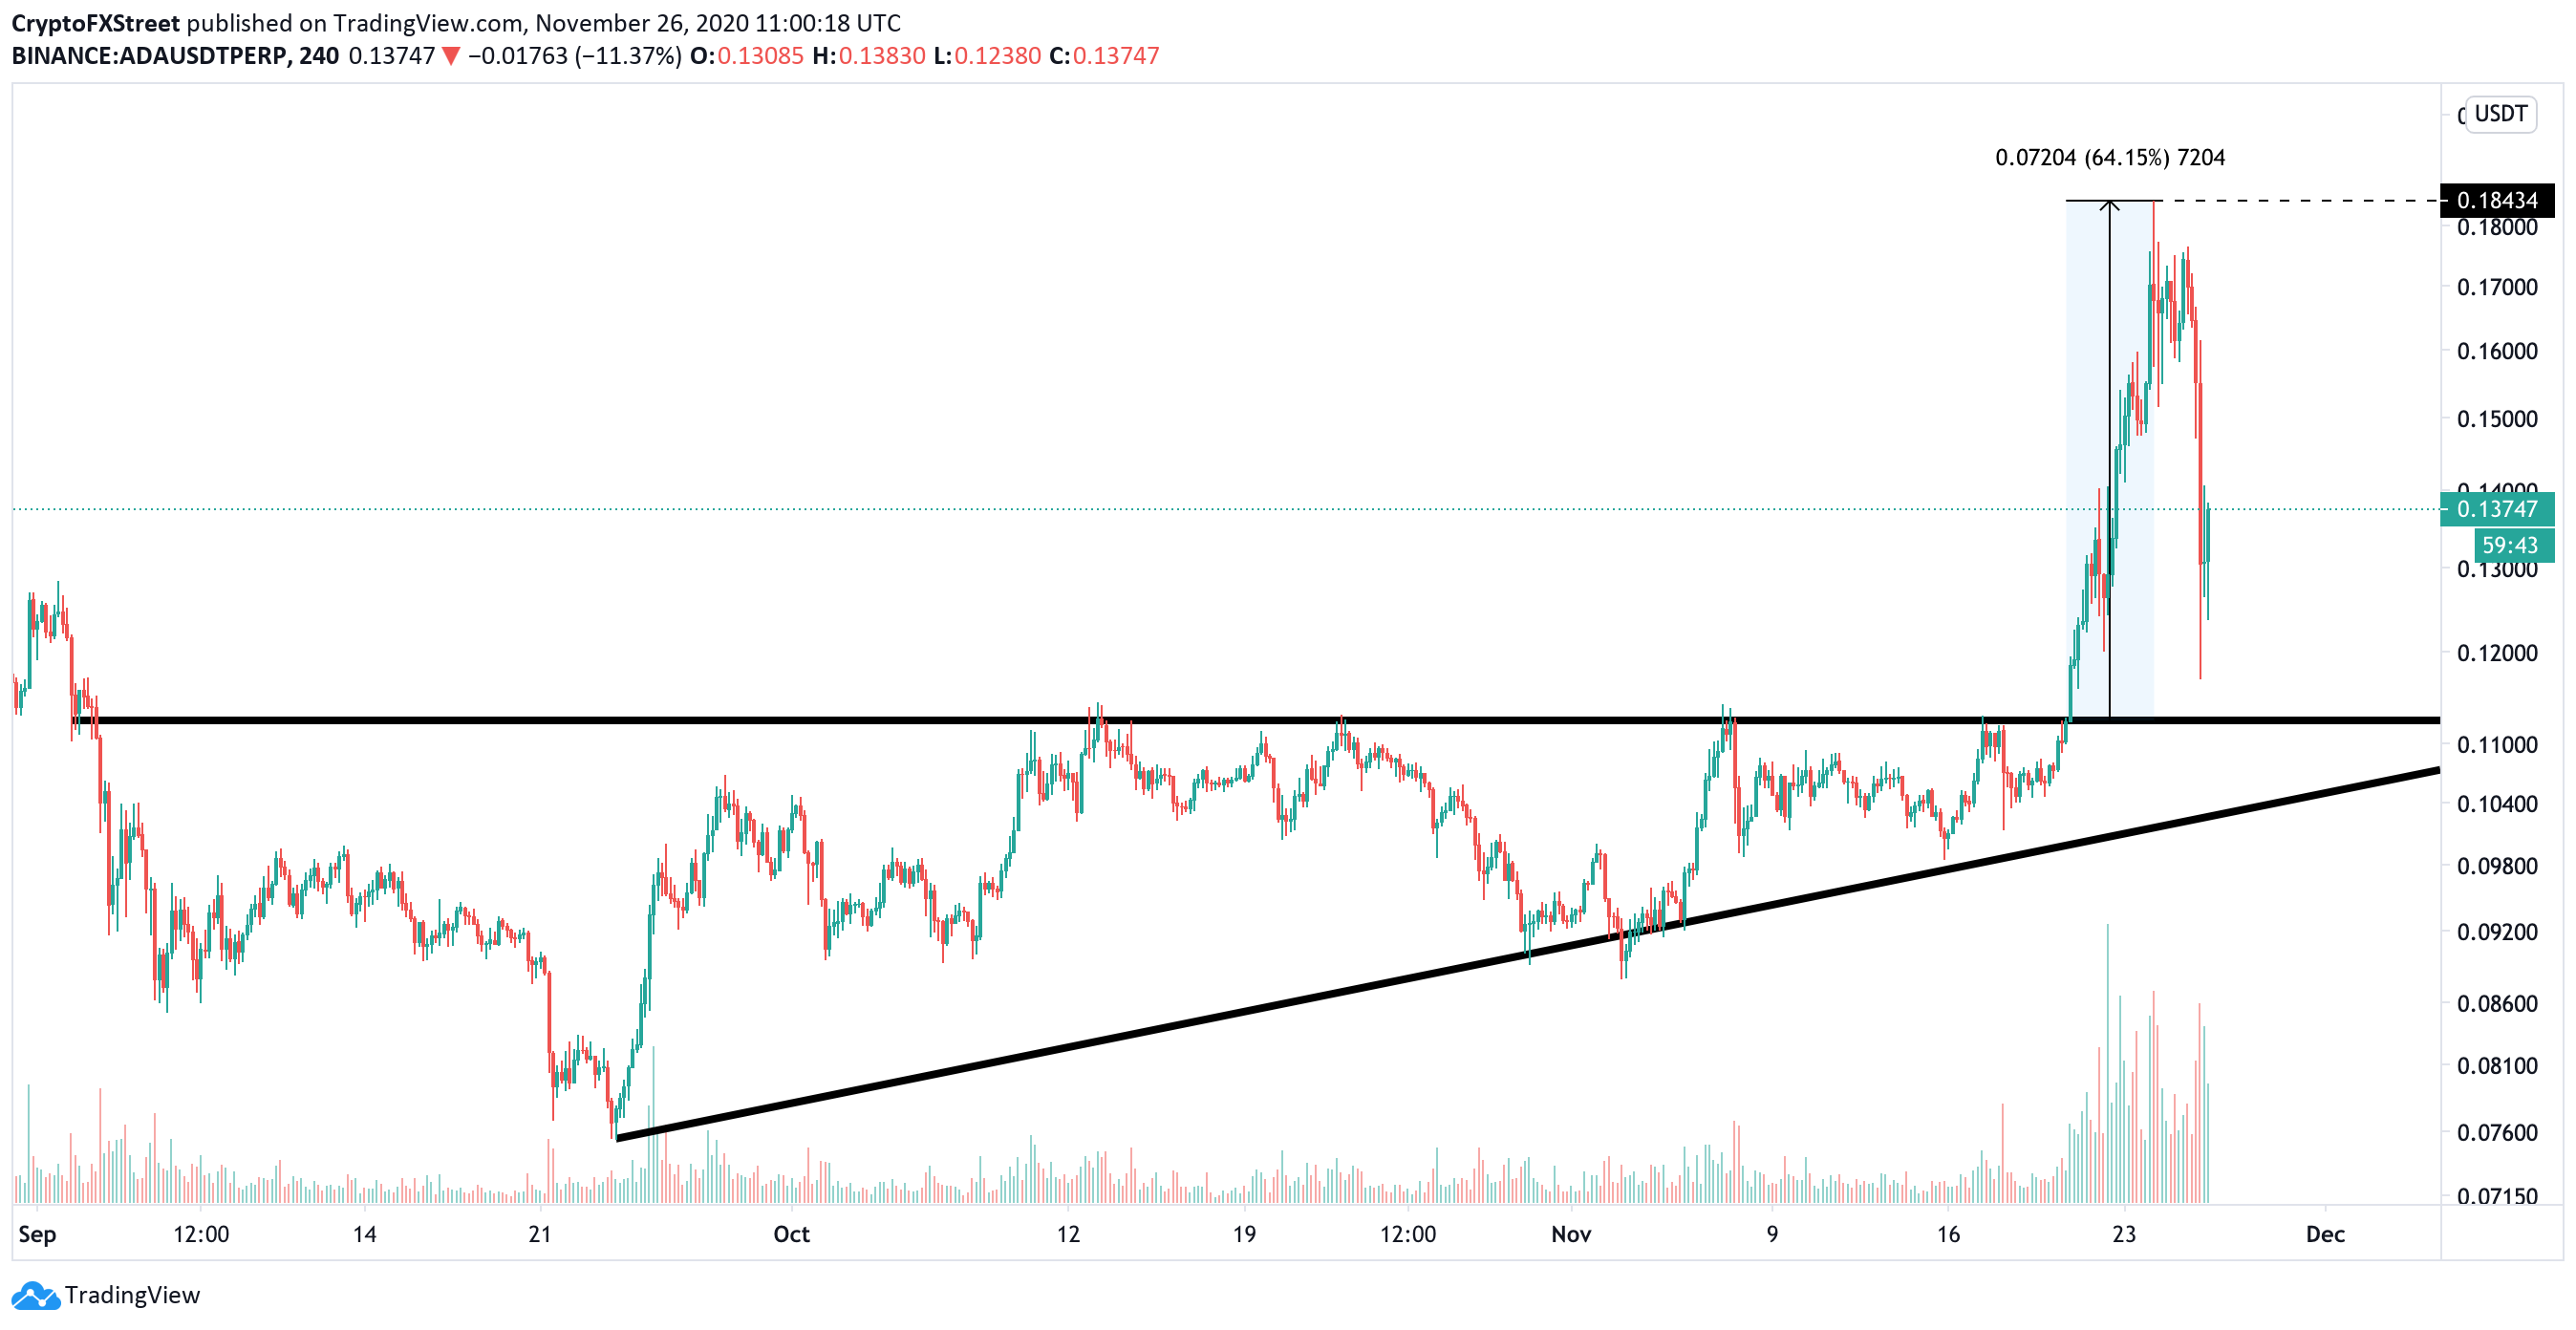
ADA/USD, 4-hour chart, triangle pattern
However, ADA reversed most of the gains overnight as the cryptocurrency market entered a sharp downside correction from the overbought levels. As the 4-hour chart above shows, Cardano is trying to regain ground above 50 EMA at $0.14. If upside momentum is sustained, the price may extend the recovery and retest the recent high at $0.194, followed by a psychological barrier of $0.2
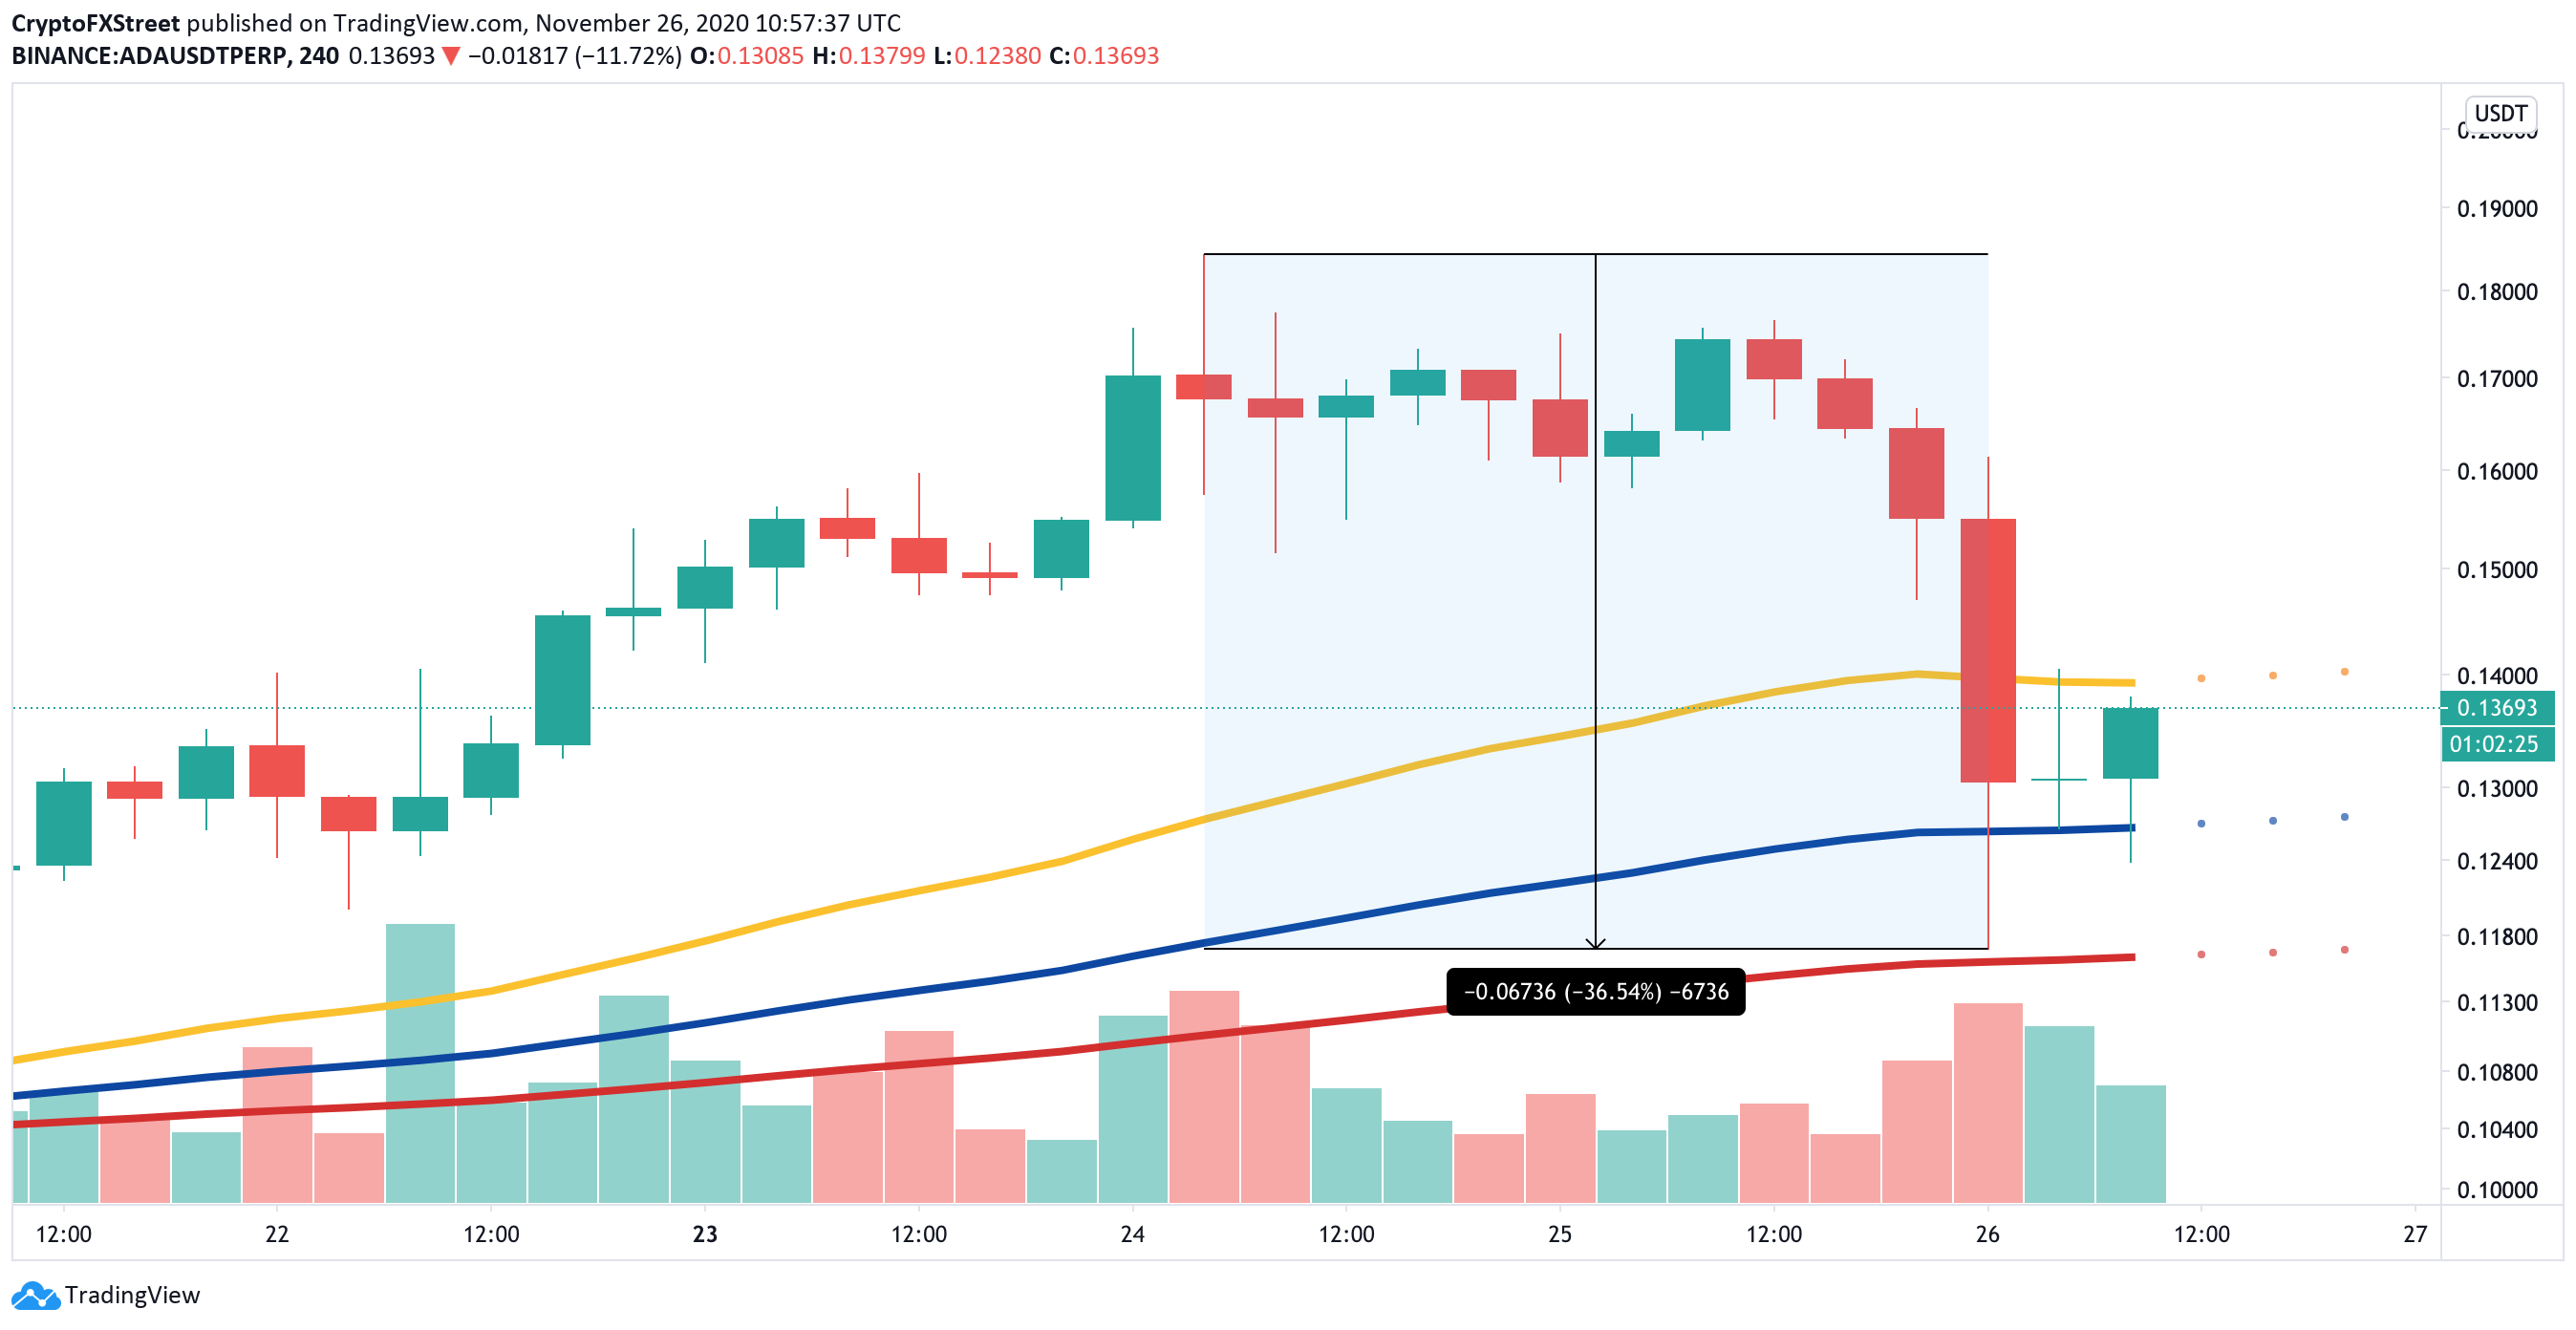
ADA/USD, 4-hour chart
Massive barrier on the way up north
However, In/Out of the Money Around Price (IOMAP) model from IntoTheBlock reveals that over 30,000 addresses bought nearly 4 billion ADA around this price point, making it a hard nut to crack for the bulls. Only a 4-hour candlestick close above this level could signal that ADA is ready to resume the recovery and take another aim at the recent high of $0.194 and the psychological level of $0.2.
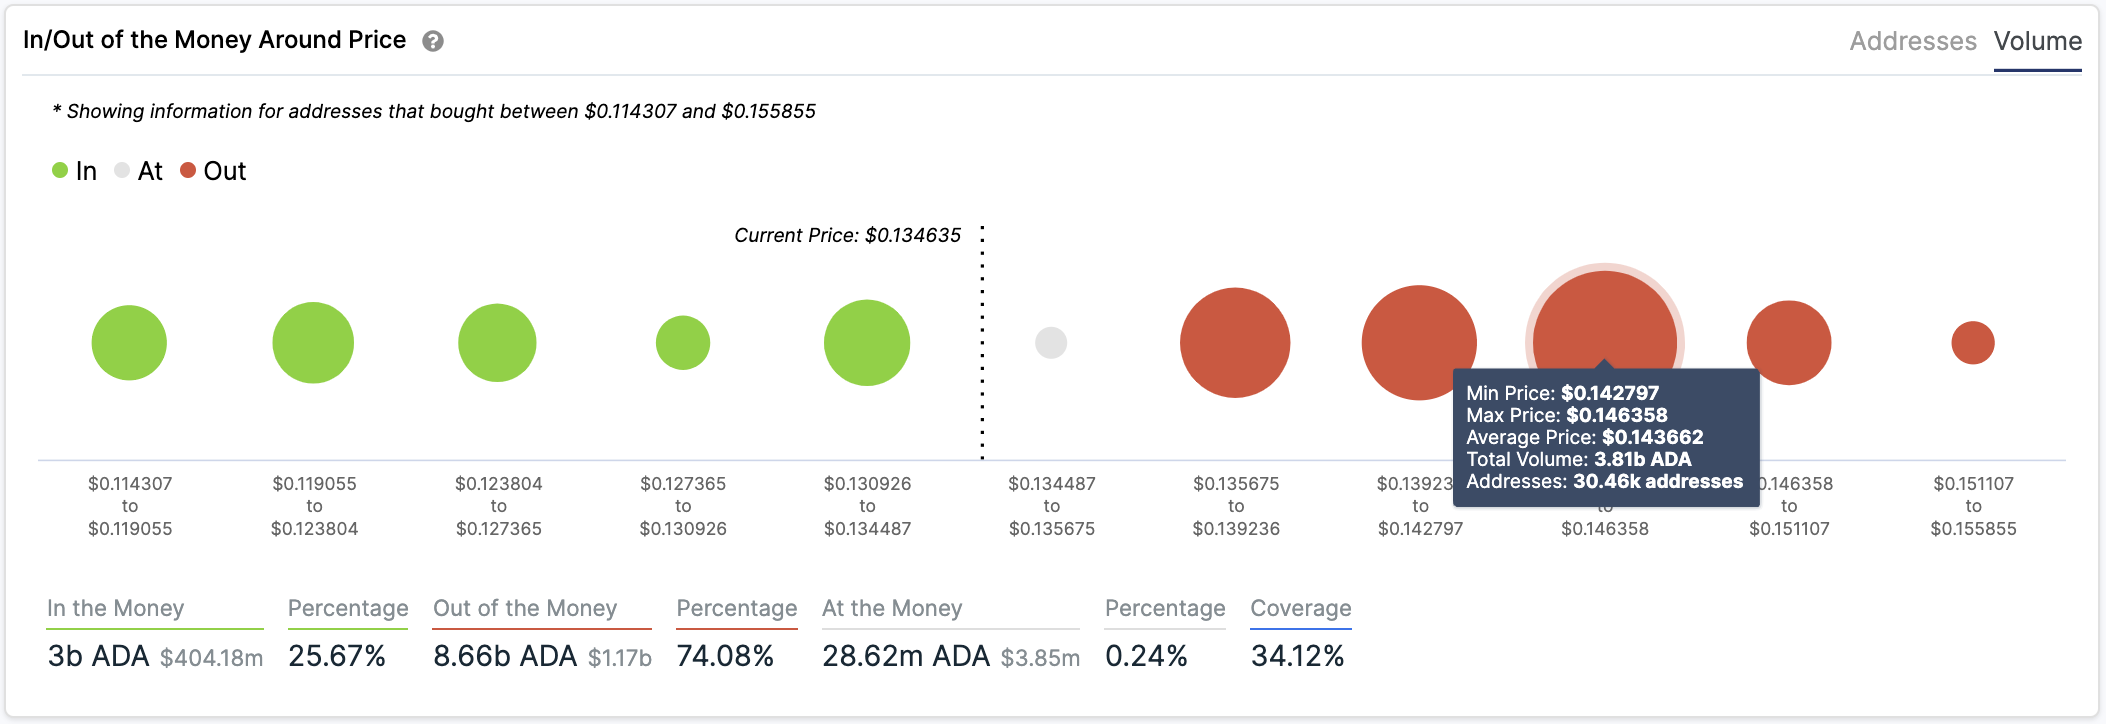
ADA’s In/Out of the Money Around Price” (IOMAP)
Otherwise, the downside momentum will gain ground and bring 4-hour 100 EMA at $0.13 into focus. This local support is followed by the upper line of the broken ascending triangle pattern on the $0.11 and 4-hour 200 EMA.
