- Stellar is moving towards an imminent breakthrough from a triangle formation.
- XLM price may move by 7% in either direction.
Stellar (XLM) hit the all-time high at $0.2337 on November 25 amid a significant bullish trend on the cryptocurrency markets and has been drifting down ever since. At the time of writing, XLM/USD is changing hands at $0.184, having lost over 2% in the past 24 hours. Despite the retreat, it is still 15% higher on a week-to-week basis.
Stellar is the 11th largest digital asset with a current market capitalization of $3.9 billion and an average daily trading volume of $504 million. Stellar’s trading volumes peaked at $3.7 at the end of November amid a substantial price increase.
Stellar is at a crossroads
From a short-term perspective, Stellar price is moving within a descending triangle pattern on the 1-hour chart. Since this formation is considered to be a bearish signal, XLM may be vulnerable to further losses if the local support created by the lower boundary of the triangle at $0.18 gives way.
A sustainable move below this area will open up to the estimated bearish target of $0.167. This target represents a nearly 7% decline. It is calculated by measuring the distance between the widest point of the triangle and adding it to the breakout point.
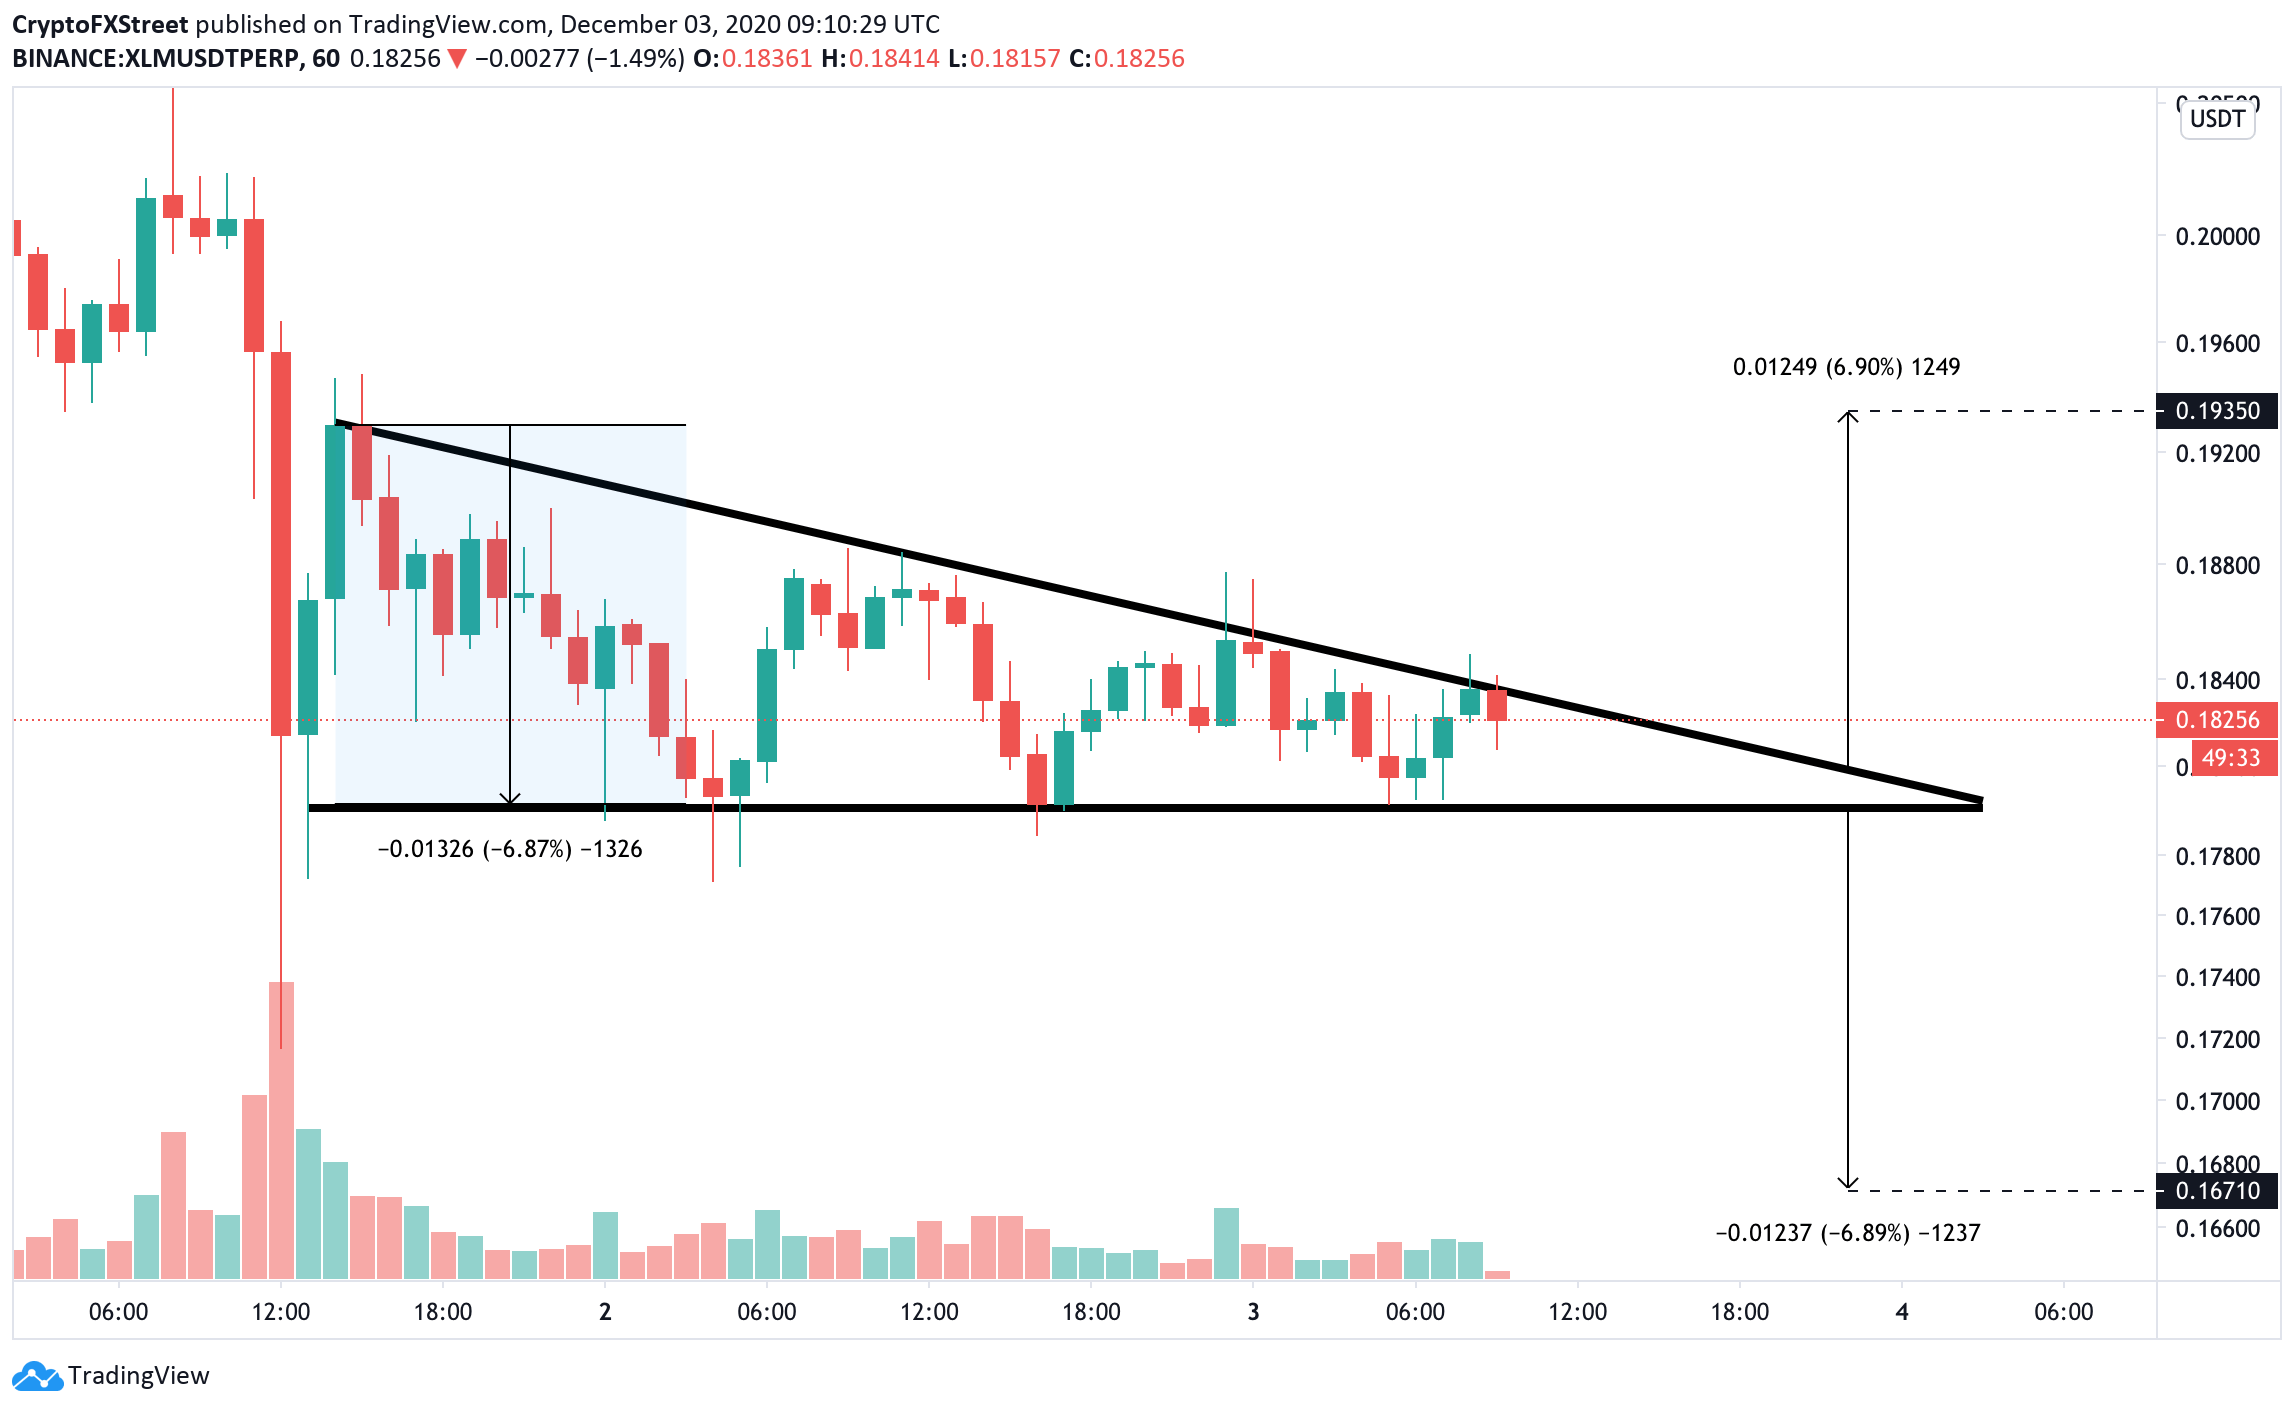
XLM/USD 1-hour chart
Meanwhile, a breakthrough above the resistance line created by the upper boundary of the descending triangle formation will negate the immediate bearish scenario and push the price towards $0.193, which is also a 7% move from a breakout point. Once this barrier is out of the way, the psychological $0.2 will come into focus, followed by the all-time high of $0.2337.
