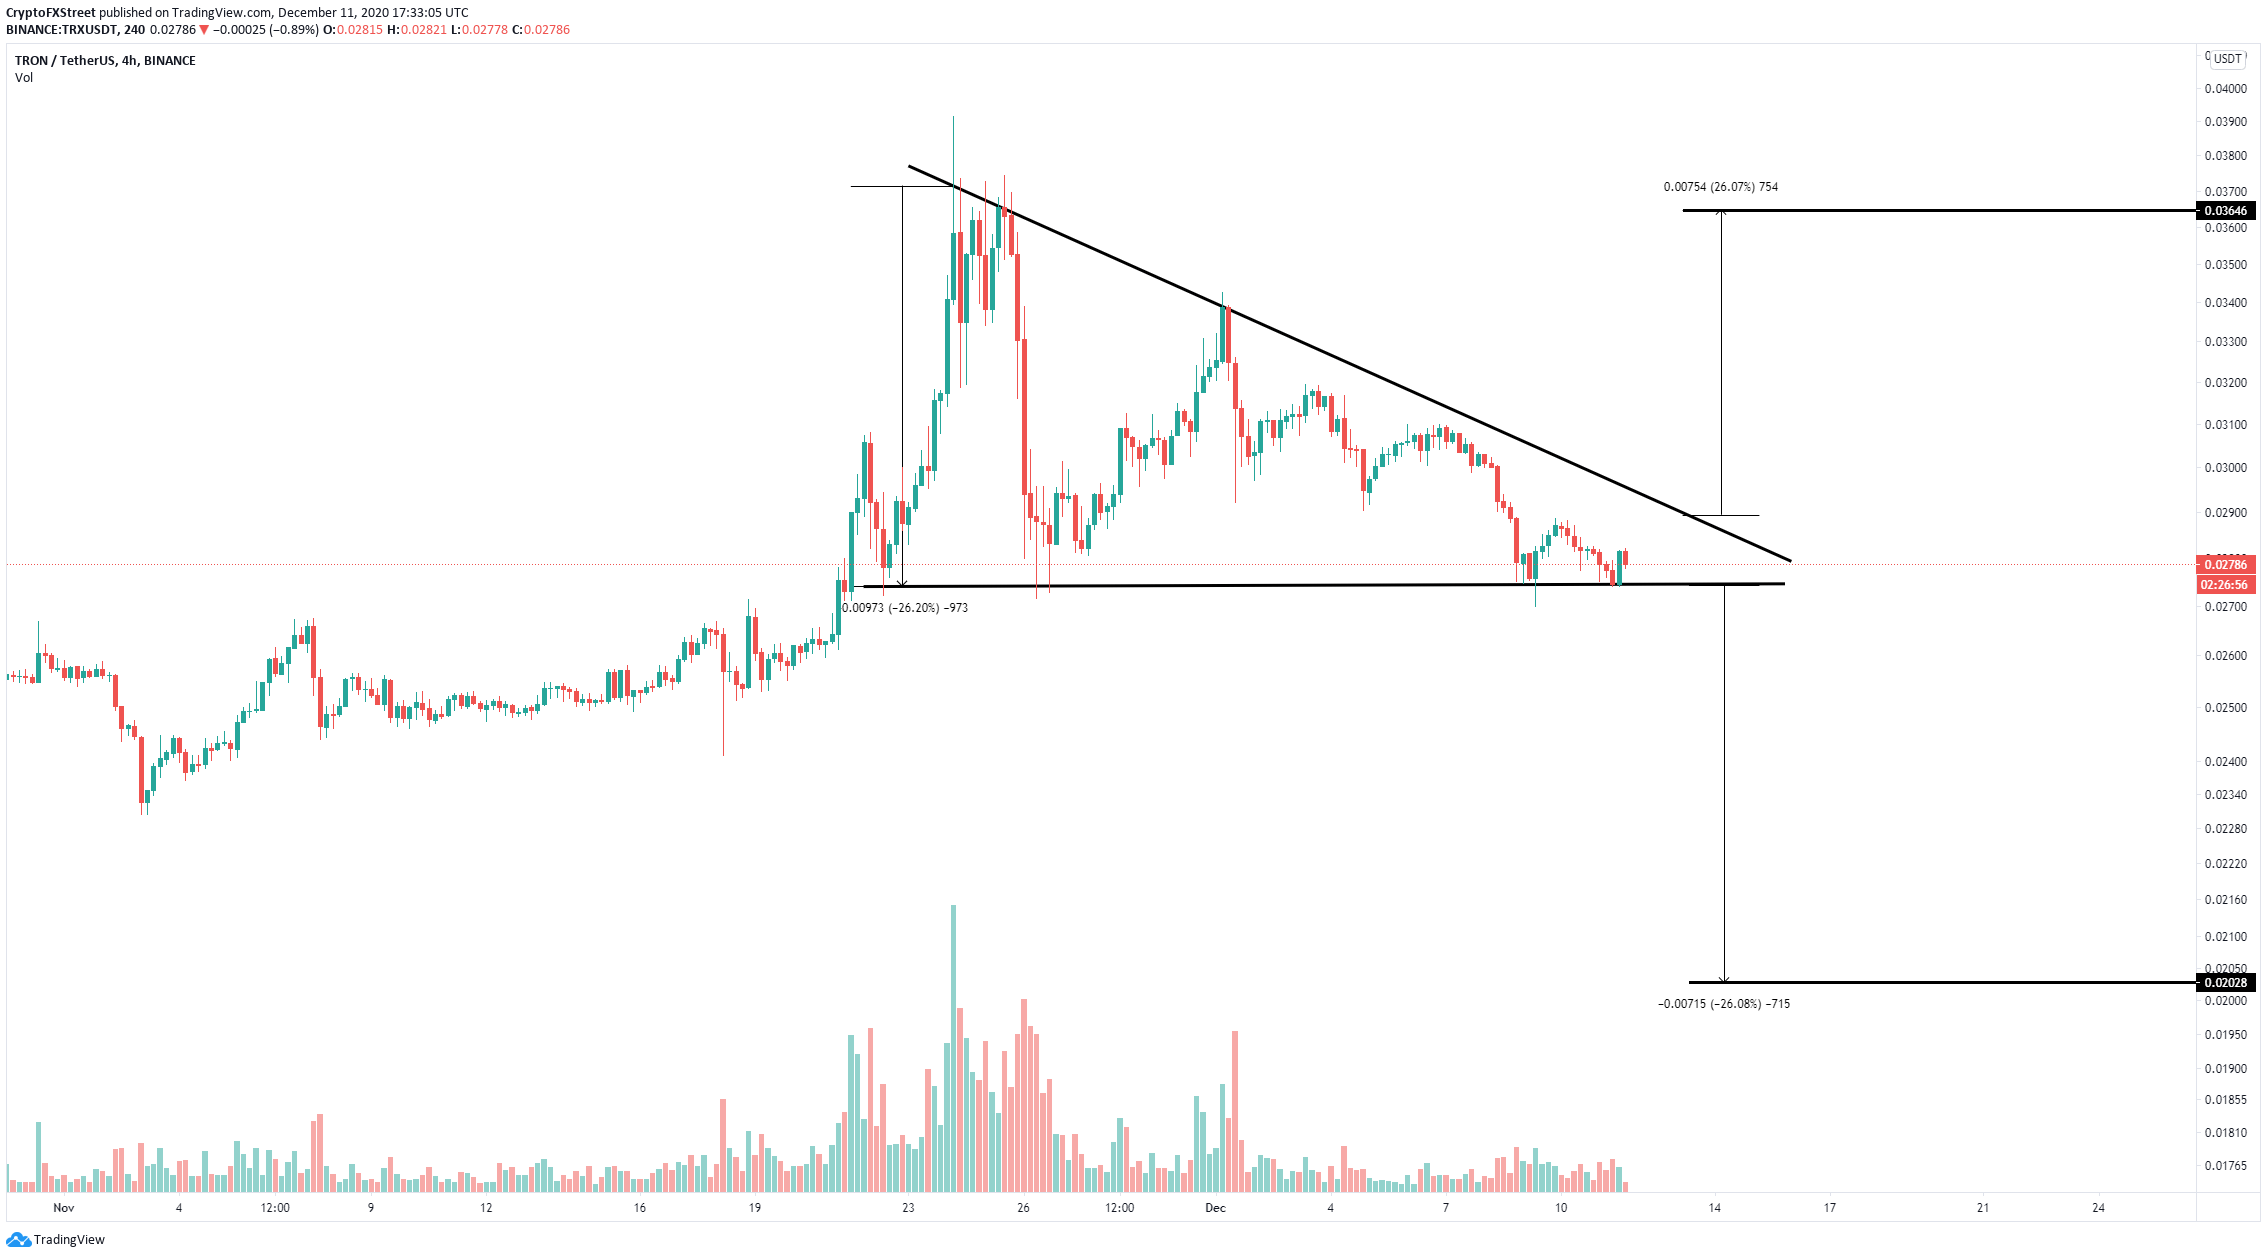
- Tron price is bounded inside a descending triangle pattern on the 4-hour chart.
- Trading volume has declined and indicates a potential price move is underway.
TRX is trading inside a descending triangle pattern at $0.0277 at the time of writing. The price is just above the lower trendline support level on the verge of a potential breakdown. Bulls need to make sure this level is defended to avoid a major pullback.
Tron price faces a potential breakdown towards $0.02
On the 4-hour chart, TRX has established a descending triangle pattern, which is close to a breakout or breakdown. Currently, the Tron price is only slightly above the lower support trendline at $0.0274.
TRX/USD 4-hour chart
Failure to hold TRX above this critical support level could push the digital asset towards a price target of $0.02, a 26% move that can be calculated using the height of the pattern as a reference point.
TRX Volume chart
At the same time, it seems that the trading volume of TRX has declined significantly since a massive spike on September 4. The digital asset had another jump on November 24, which only lasted 24 hours. The current volume is at its lowest point since August 25 and indicates Tron price is on the verge of a breakout or breakdown.
Of course, if the bulls can successfully defend the support level at $0.0274 and push the Tron price above the upper trendline resistance of the pattern at $0.029, the digital asset might quickly jump towards $0.036.

%20%5B18.34.46,%2011%20Dec,%202020%5D-637433050737564708.png)
