- Tezos price is bounded inside a descending parallel channel on the 4-hour chart.
- The digital asset got rejected from a critical resistance level and might be poised for a pullback.
Tezos had a notable 10% rally in the past 48 hours, following Bitcoin’s price action, which has established a new all-time high. Unfortunately, Tezos price got rejected from a crucial resistance trendline and could be poised for a deeper pullback.
Tezos price turns bearish after significant rejection
On the 4-hour chart, Tezos price has established a descending parallel channel and got rejected from the upper trendline on December 17. Bears seem to be getting enough continuation after the rejection, which indicates it is healthy.
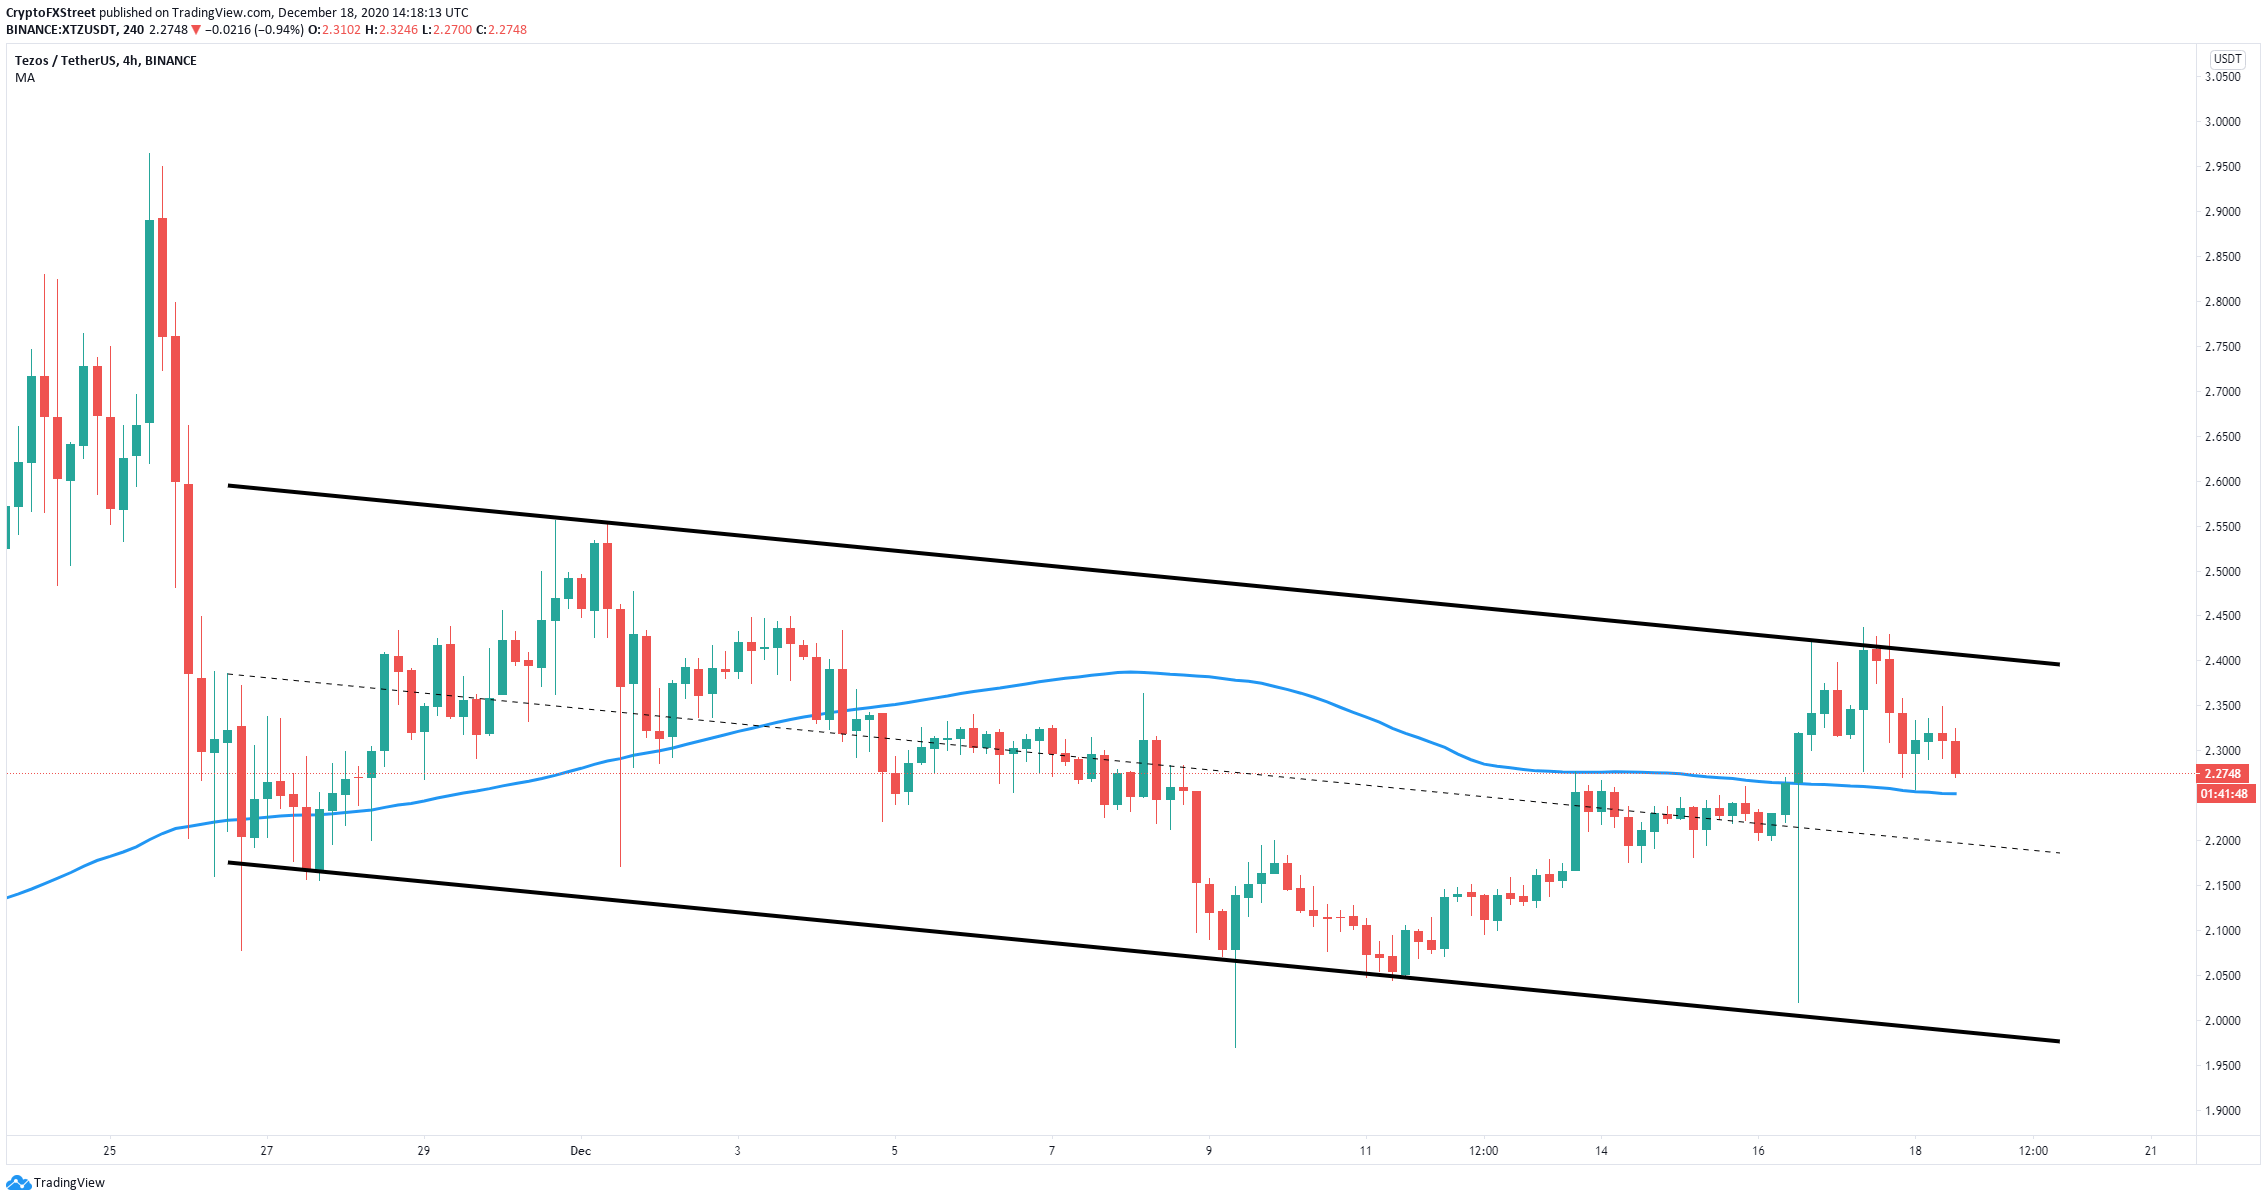
XTZ/USD 4-hour chart
So far, the 100-SMA has acted as a support level, and a breakdown below this point can quickly drive Tezos price towards the middle trendline of the channel at $2.2 and as low as the lower trendline at $2.
On the other hand, if bulls can defend the 100-SMA level at $2.25, Tezos price is most likely going to climb back towards the upper boundary of the descending parallel channel at $2.4.
