- Theta price jumped 90% since December 22 and has been really volatile for the past four days.
- There is one critical indicator that suggests the digital asset is poised for a significant correction.
Theta was trading at $0.92 on December 22 before a massive rally towards $1.74 in just one week, climbing by almost 90%. Theta has been under consolidation ever since and is potentially forming a bull flag on the daily chart.
Theta price at risk of falling to $1 if this signal is confirmed
On the daily chart, the TD Sequential indicator has presented a green ‘8’ candle which is usually followed by a strong sell signal. The most significant support level could be the 26-EMA located at $1, which is the bearish price target.
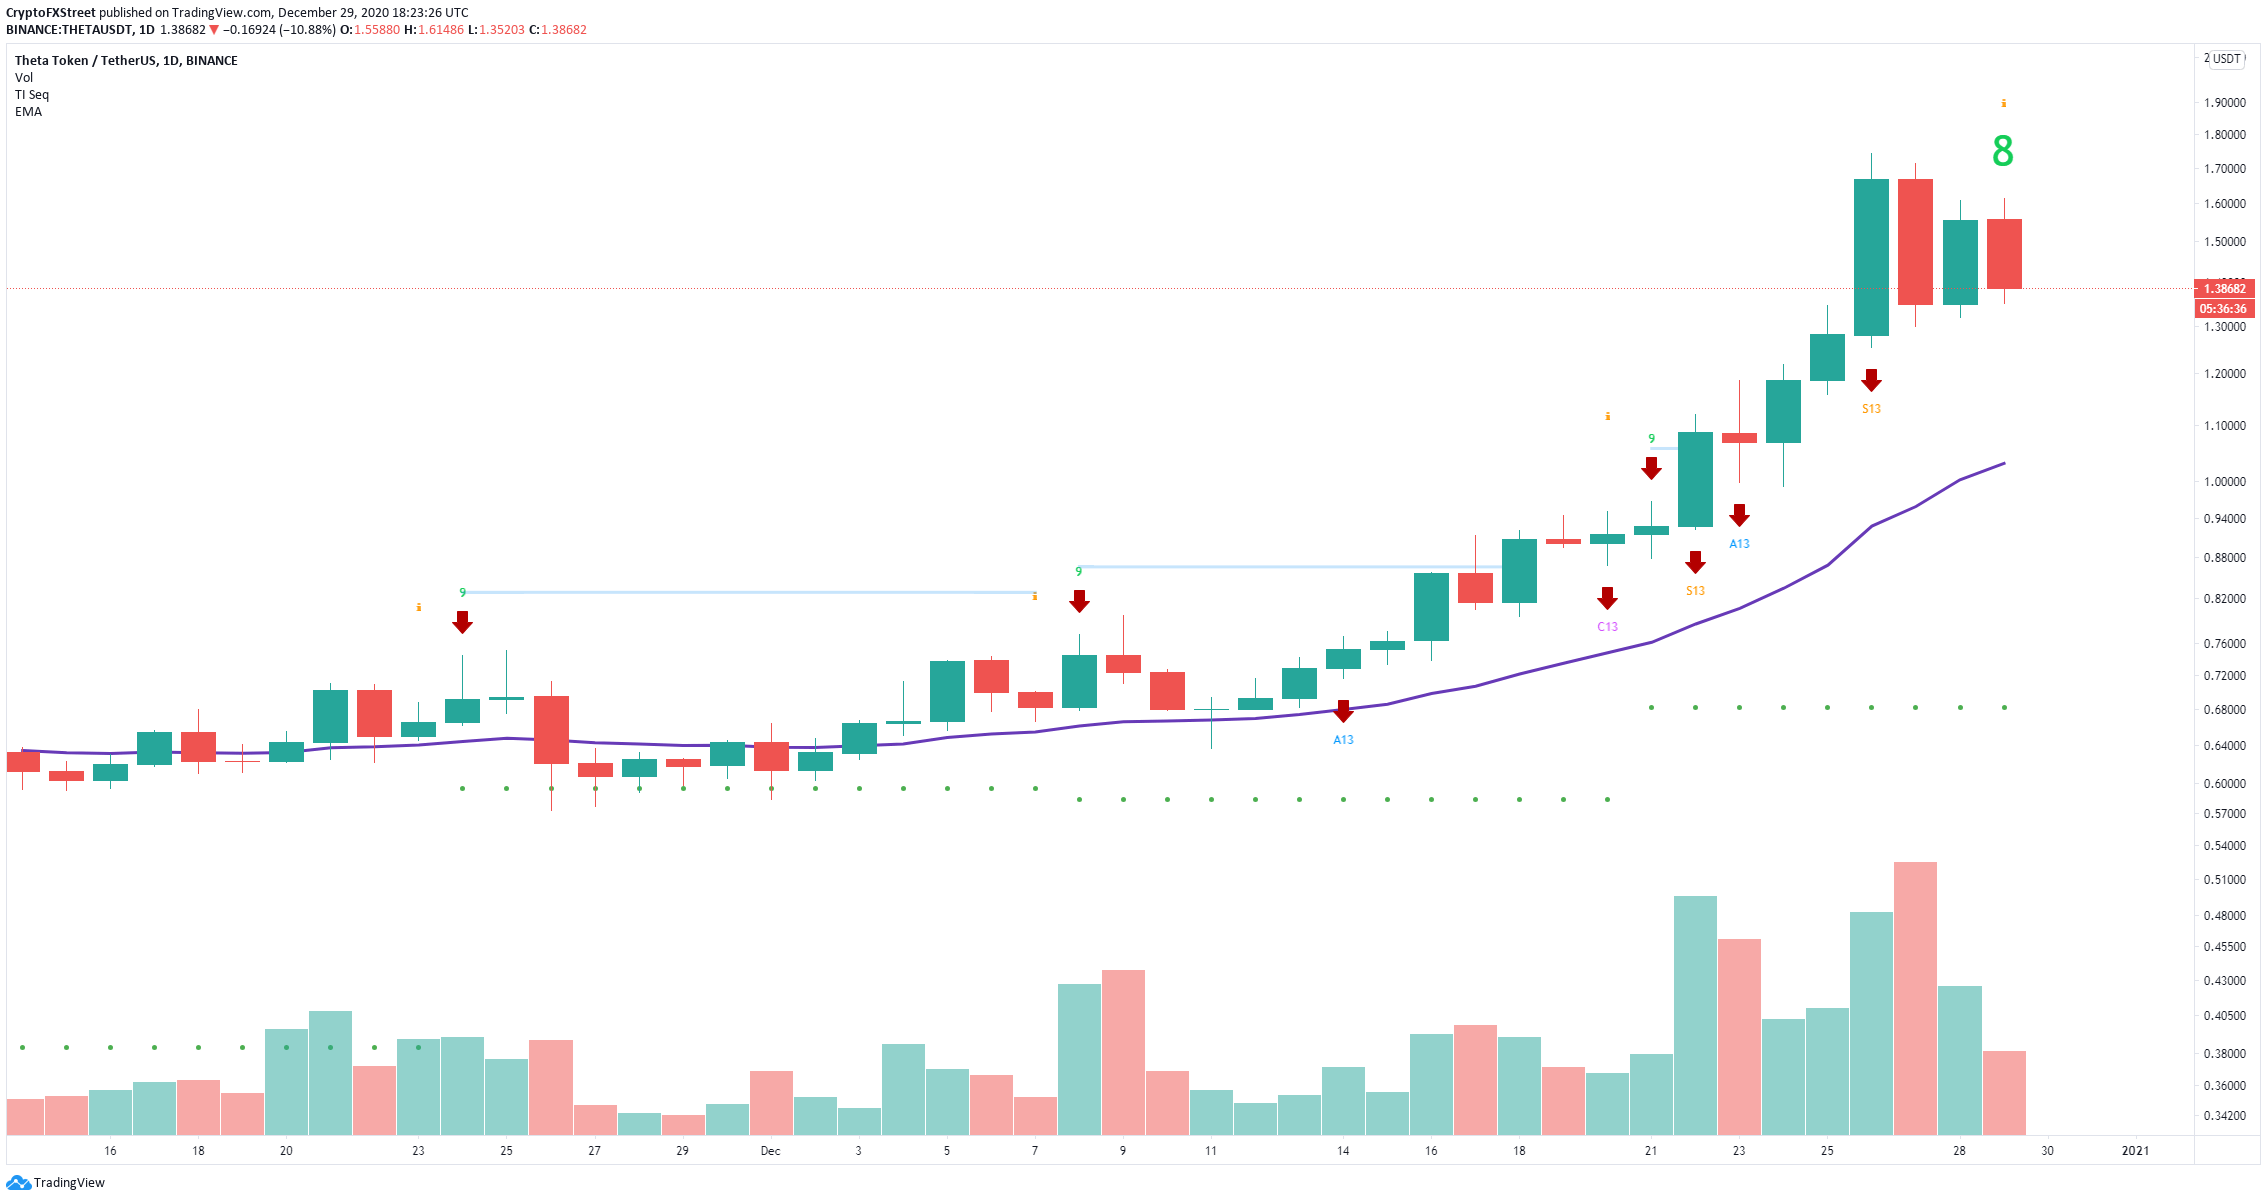
THETA/USD daily chart
On the 4-hour chart, Theta has formed a symmetrical triangle pattern which seems to be favoring the bears currently. A breakdown below the lower support trendline at $1.38 can quickly drive Theta price down to $1, which also coincides with the 100-SMA and the 26-EMA on the daily chart, giving more credence to this price target.
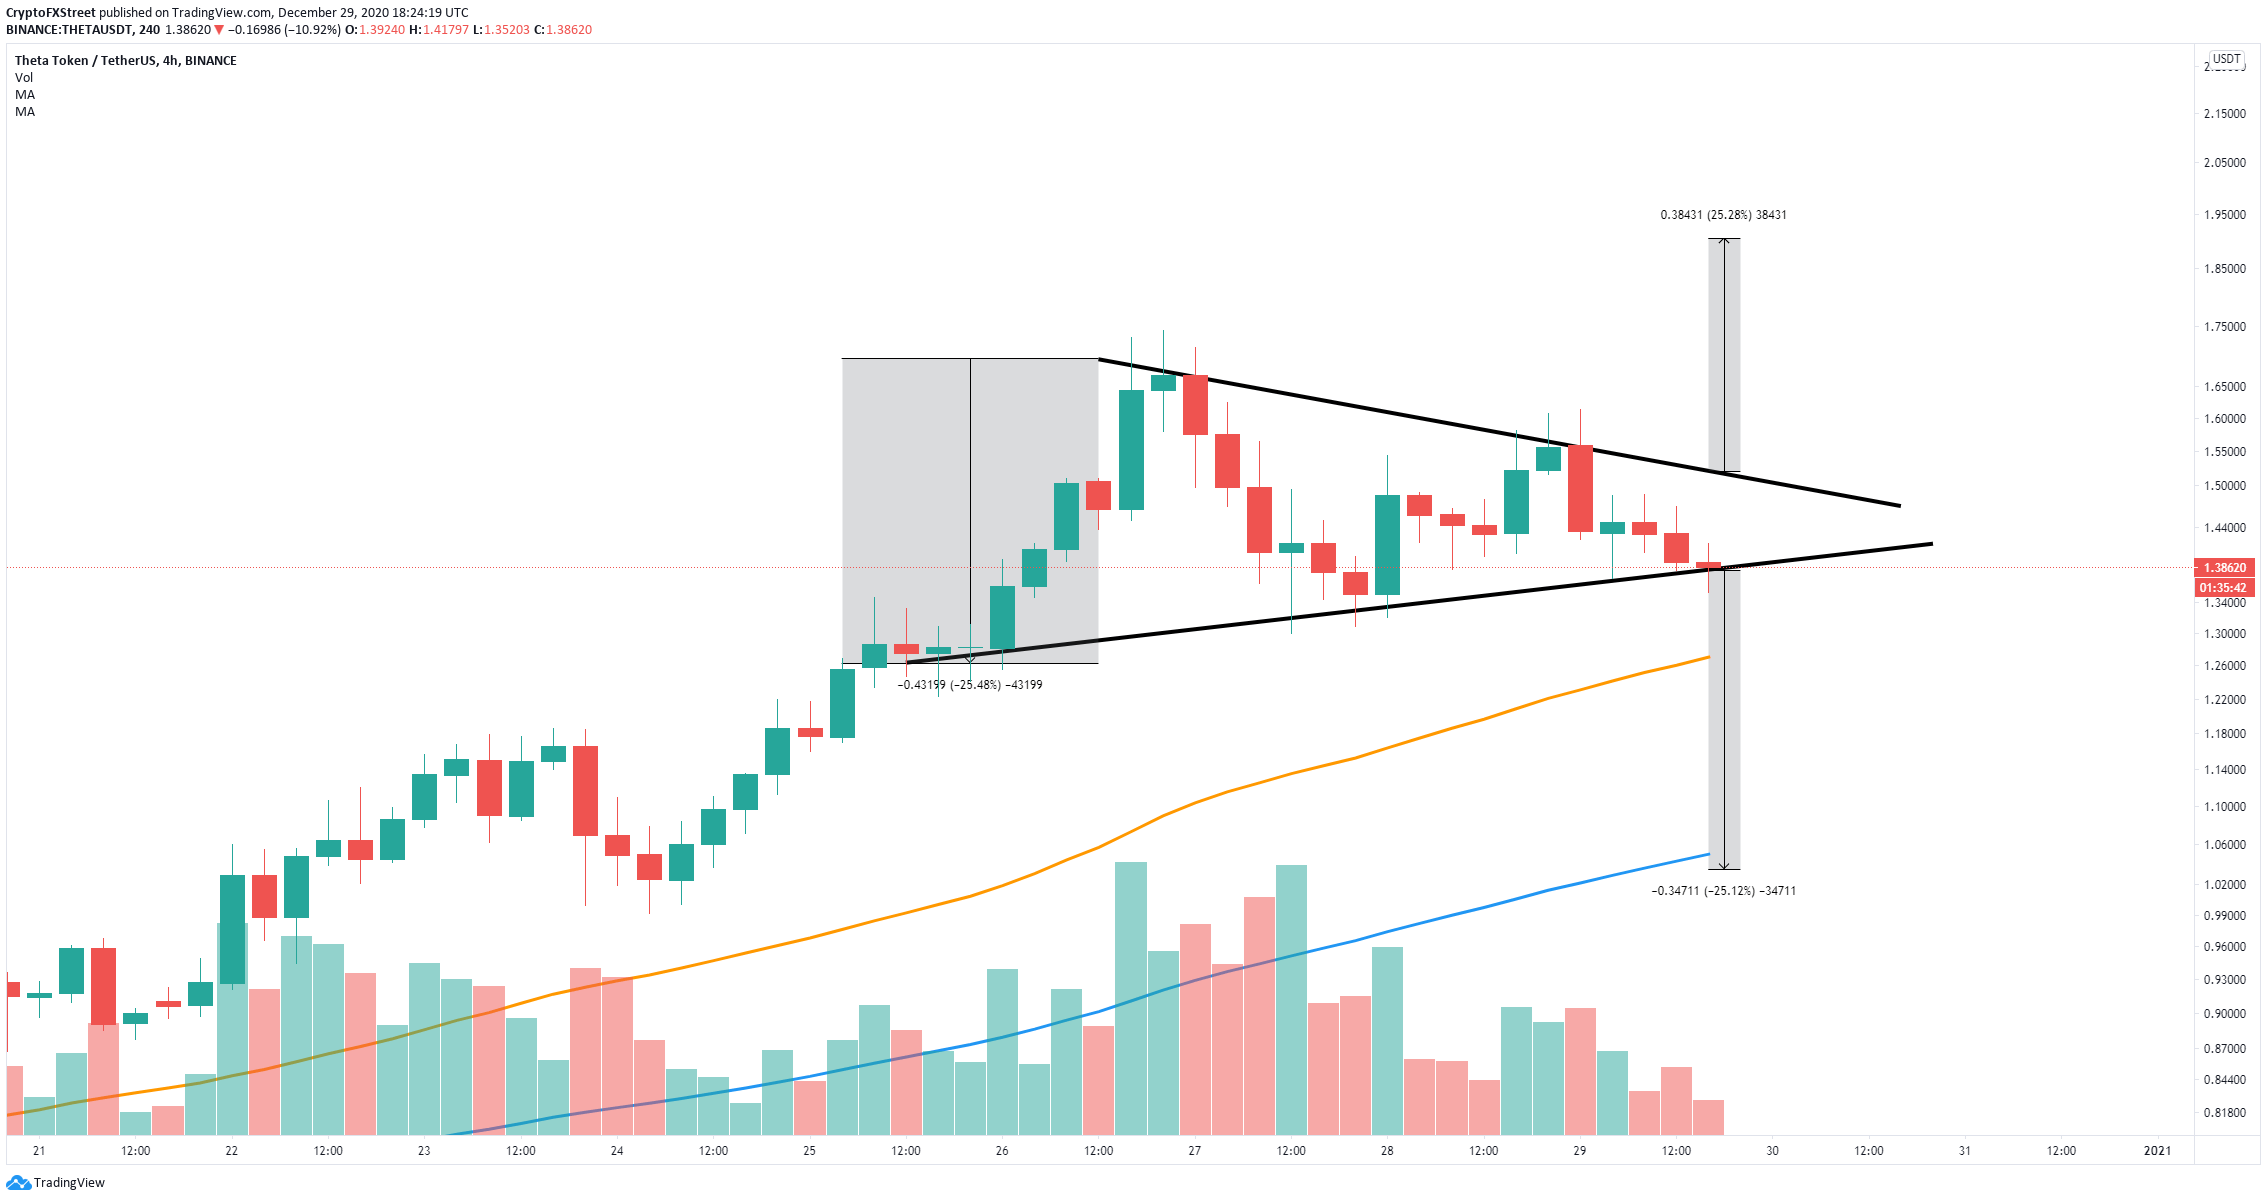
THETA/USD 4-hour chart
On the other hand, if the bulls can step up and defend the $1.38 support point, Theta can quickly jump towards $1.5. A breakout above this point would drive the digital asset’s price towards a high of $1.9.
